The Data window has many features and functions to help you organize your data fields, find specific fields, and hide others.
You can reorganize the Data window from its default layout by selecting from a variety of sorting options. These Sort by options are located in the Data window menu.
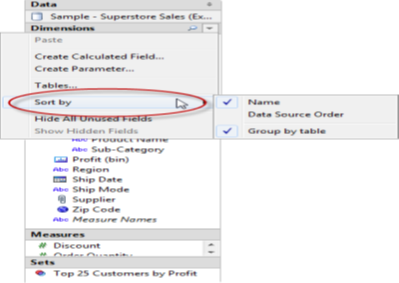
You can sort by one of the following options:
You can also select to Group by Table, which is a command that toggles on and off. When you select this option, the dimensions and measures are grouped according to the database table they belong to. This is especially useful when you have several joined tables.
You can search for fields in the Data window. If there are many fields in your data source it can be difficult to find a specific one like “Date” or “Customer” or “Profit.” To search for a field, click the Find Field icon at the top of the Data window (Ctrl + F) and type the name of the field you want to search for. Valid field names that fit the description appear in a drop-down list. Select the field you want and press enter on your keyboard to highlight the field in the Data window.
You can assign an alternate name for a field that displays in the Data window as well as in the view. For instance, a field called Customer Segment in the data source could be aliased to appear as Business Segment in Tableau. You can rename both dimensions and measures. Renaming a field does not change the name of the field in the underlying data source, rather it is given a special name that only appears Tableau workbooks. The changed field name is saved with the workbook as well as when you export the connection.
Renaming a Field
The field displays with the new name in the Data window.
You can selectively hide or show fields in the Data window. To hide a field, right-click the field you want to hide and select Hide.
You can create calculated fields that appear in the Data window. These new computed fields can be used like any other field. Select Create Calculated Field on the Data window menu. Alternatively, select Analysis > Create Calculated Field.
At TekSlate, we offer resources to help you learn various IT courses. We avail both written material and demo video
     tutorials. For in-depth knowledge and practical experience explore Tableau Training.
When you drag fields to shelves, the data is represented as marks in the view. You can specify settings for how the marks from each field will be displayed by setting mark properties. For example, when you place a dimension on the color shelf the marks will be colored by the values within that dimension. You can set the Color property so that anytime you use that dimension on the color shelf your chosen colors are used. Using field properties you can set the aliases, colors, and shapes, default aggregation, and so on.
Fields can have comments that describe them. The comments display in a tool tip in the Data window and in the Calculated fields dialog box. Field comments are a good way to give more context to the data in your data source. Comments are especially useful when you are building a workbook for others to use.
Aliases are alternate names for specific values within a dimension. Aliases can be created for the members of most dimensions in the Data window. You cannot, however, define aliases for continuous dimensions and dates and they do not apply to measures.
The method for creating aliases depends on the type of data source you are using.
When you use a dimension to color encode the view, default colors are assigned to the field’s values. Color encodings are shared across multiple worksheets that use the same data source to help you create consistent displays of your data. For example, if you define the Western region to be green, it will automatically be green in all other views in the workbook. You can set the default color encodings for a field by right-clicking the field in the Data window and selecting Field Properties > Color.
When you use a dimension to shape encode the view, default shapes are assigned to the field’s values. Shape encodings are shared across multiple worksheets that use the same data source to help you create consistent displays of your data. For example, if you define the Furniture products are represented with a square mark, it will automatically be changed to a square mark in all other views in the workbook. You can set the default shape encodings for a field by right-clicking the field in the Data window and selecting Field Properties > Shape.
You can set the default text format for date and number fields. For example, you may want to always show the Sales values as currency using the U.S. dollar sign and two decimal points. On the other hand, you may want to always show Discount as a percentage. You can set the default formats by right-clicking a date or numeric field and selecting and option on the Field Properties menu. A dialog box opens where you can specify a default format.
You can set a default sort order for the values within a categorical field so that every time you use the field in the view, they values will be sorted correctly. For example, let’s say you have an Order Priority field that contains the values High, Medium, and Low. When you place these in the view, by default they will be listed as High, Low, Medium because they are shown in alphabetical order. You can set a default sort so that these values are always listed correctly. To set the default sort order right-click a dimension and select Field Properties > Sort. Then use the sort dialog box to specify a sort order.
Note:
The default sort order also controls how the field values are listed in a quick filter.
You can also specify a default aggregation for any measure. The default aggregation will be used automatically when the measure is first totaled in the view.
To specify a default aggregation:

Whether you are specifying the aggregation for a field on a shelf or the default aggregation in the Data window, you can select from the following options:
Default
For Microsoft Analysis Services data sources, this option computes the aggregation on the server.
For Essbase data sources, this option computes the total using the default aggregation determined by the data type (typically SUM).
SUM
Displays the sum of all shown values.
Average
Displays the average of all shown values.
Minimum
Displays the smallest shown value.
Maximum
Displays the largest shown value.
Server
Computes the aggregation on the server.
There are times that you will want to show multiple measures in a view and so you will use the Measure Values and the Measure Names fields. When you use Measure Names all of the measure names appear as row or column headers in the view. However, the headers include both the measure name and the aggregation label. So if you are showing the summation of profit the header displays as SUM(Profit). You can change the names so that they do not include the aggregation label by editing the member aliases of the Measure Names field. This feature becomes particularly useful when you are working with a text table that shows multiple measures.
For indepth knowledge on Tableau, click on below
You liked the article?
Like: 0
Vote for difficulty
Current difficulty (Avg): Medium

TekSlate is the best online training provider in delivering world-class IT skills to individuals and corporates from all parts of the globe. We are proven experts in accumulating every need of an IT skills upgrade aspirant and have delivered excellent services. We aim to bring you all the essentials to learn and master new technologies in the market with our articles, blogs, and videos. Build your career success with us, enhancing most in-demand skills in the market.

