The basics of using Tableau to build views of your data. You will learn how to build views both manually and automatically using the built in tools.
Additionally, you will learn how to sort, filter, group, create sets. Finally, this section includes information about working with dates and times, adding reference lines and bands, and viewing your data.
Data views are displayed in a table on every worksheet. A table is a collection of rows and columns, and consists of the following components: Headers, Axes, Panes, Cells, and Marks.In addition to these, you can optionally show Titles, Captions, Field Labels, and Legends.

Headers are created when you place a dimension on the Rows shelf or the Columns shelf. The headers show the member names of each field on the shelves.
Axes are created when you place a measure on the Rows or Columns shelf. By default, the values of the measure field are displayed along a continuous axis.
Panes are created by the intersection of the rows and columns in a table. Depending on the table type, panes might be created by the intersection of an axis with headers, an axis with an axis, or headers with headers. Panes are identified by lines within the table.
Cells are the basic components of any table you can create in Tableau.
  Our course design of tutorials is practical and informative. At TekSlate, we offer resources
   to help you learn various IT courses. We avail both written material and demo video tutorials.
     For in-depth knowledge and practical experience explore Tableau Training Course.
Tableau does not use chart types to build data views. Instead, data are displayed with marks, where every mark corresponds to a row (or a group of rows) in your data source.
You can add a title to any worksheet or dashboard. The title is displayed on the Title card.
All views can have a caption that is either automatically generated or manually created.
Placing discrete fields on the rows and column shelves creates headers in the view that display the members of the field.
When you add fields to any of the encoding shelves such as the Color, Shape, and Size shelves, a legend appears to indicate how the view is encoded with relation to your data.

Not only do legends help you understand encoding, you can also use legends to sort, filter, and highlight specific sets of data.
Filters are defined by selecting specific dimension members or a range of measure values. For example a view showing product sales in four different regions may be filtered to only show three regions. In this case, the filter is created by selecting the specific regions to show. Another example may be to filter the same view to only show sales between $5000 and $20,000. For this filter a range of values is defined. In addition to these basic filters you can create complex computed filters to show the top 10 products based on sales, all products sold in the last 30 days, and so on.
All fields that are filtered display on the Filters shelf so you can quickly determine the data that has been removed from the view. Filters are applied to the view in the order they appear on the Filters shelf. However, by default filters are evaluated independently from each other, which means each filter is evaluated against the entire underlying data source and other filters are not taken into account. When working with independent filters, the order on the filters shelf does not change the results.
Adding Filters: All fields that are filtered show on the Filters shelf. You can add a filter either by selecting data in the view, dragging a field to the Filters shelf, or turning on quick filters.
Global Filters:A global filter is a filter that applies to all worksheets in the workbook that are connected to the same data source..
Context Filters: By default, all filters that you set in Tableau are computed independently. That is, each filter accesses all rows in your data source without regard to other filters. However, you can set one or more categorical filters as context filters for the view. You can think of a context filter as being an independent filter. Any other filters that you set are defined as dependent filters because they process only the data that passes through the context filter.
Calculation Filters:
Filters on dimensions that are not used elsewhere in the view are called calculation filters. For these types of filters, Tableau performs a calculation on the selected dimension members, This occurs when:
The calculation icon displays next to the field’s name to indicate this operation.
The calculation matches the aggregation for each measure used in the view.
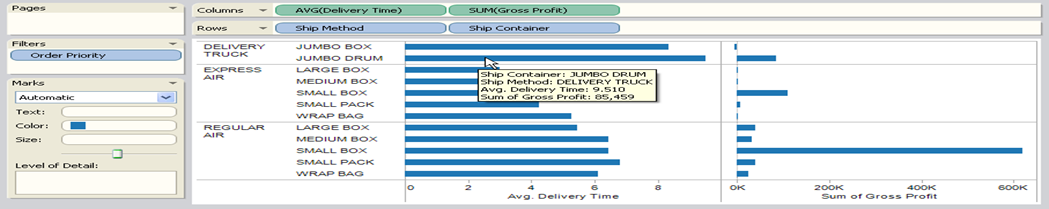
Consider the view shown below. It consists of the Profit measure aggregated as a summation and the Order Quantity measure aggregated as an average. These measures are displayed with the Ship Mode and Container dimensions. An external filter that consists of two members of the Order Priority dimension is applied to the data.
Tableau automatically applies the appropriate calculation to the members of the external filter based on the aggregation of each measure. Therefore, a summation is performed for Profit and an average is performed for Order Quantity.
For example, the tooltip shows the data for Jumbo Drums delivered by truck. The average order quantity is 24.3. This number was calculated by averaging the order quantities for all the rows that have an Urgent or High order priority. Similarly, the sum of profit is $114,363. This number was calculated by summing the profit for all the rows that have an Urgent or High order priority.
For indepth knowledge on Tableau, click on below
You liked the article?
Like: 0
Vote for difficulty
Current difficulty (Avg): Medium

TekSlate is the best online training provider in delivering world-class IT skills to individuals and corporates from all parts of the globe. We are proven experts in accumulating every need of an IT skills upgrade aspirant and have delivered excellent services. We aim to bring you all the essentials to learn and master new technologies in the market with our articles, blogs, and videos. Build your career success with us, enhancing most in-demand skills in the market.

