Data is playing a prominent role in the business world. Data became the currency for organizations to make smarter decisions based on the information. Tableau is one of the most used tools to analyze and visualize the data. Most of the fortune companies are adopting Tableau. According to the survey, the use of Tableau tools is eventually increased and opportunities for Tableau experts are more in the tech market.
Tekslate experts compiled Top Tableau Interview Questions and Answers for Freshers and experienced candidates. Our Tableau Interview Questions help you to crack the interview.
Ans: Tableau is a business intelligence platform that is easy and flexible for visually analyzing information. Users can distribute and create a shareable and interactive dashboard, representing the patterns, density, and variations of the information as charts and graphs. Tableau can connect with documents, social, and Big Data sources to process and acquire the information. The software allows real-time collaboration and data blending to make it unique. It is utilized by organizations, government sectors, and many research centres to analyze the data.
Ans: Data Visualization is simply the technique by which information is represented through visual depiction. For thousands of years, people utilized visuals to describe their world. Data Visualization gives an available and moment understanding using the solid visual treatment plan of our minds.
Technological development has eventually increased the importance of business intelligence for visualizing the data effectively. Tableau drives the world in giving organizations individuals all foundations and areas with the information representation measure. Worldwide organizations comprehend that the capacity to envision data proficiently prompts improvement. Information representation encourages the comprehension of enormous and little information by the human brain and encourages the location of examples, patterns, and exceptions in gatherings. Great perception of data should situate importance in complex datasets, so your message is clear and compact. A few advantages are as per the following:
| Do you want to Master Tableau? Then enroll in "Tableau Training" This course will help you to master Tableau |
Ans: Following are some of the essential features of tableau which help it to gain immense popularity in a very short period.
Ans: Following are various Tableau products:
Tableau Desktop:
It is a self-administration business analytics and data visualization which can be utilized by anyone. It renders pictures of information into enhanced inquiries. With the Tableau desktop, you can directly associate with information from your data warehouse centre for life up to date data analysis. You can perform inquiries without composing a solitary line of code. Import all your information into Tableau's data engine from different sources and incorporate it by and large by consolidating numerous perspectives in an intelligent dashboard.
Tableau Server:
It is a greater amount of big business level Tableau software. You can issue dashboards with Tableau Desktop and offer them all through the association with an online Tableau server. It leverages quick databases through live connections.
Tableau Online:
This is a facilitated variant of the Tableau server which makes business intelligence quicker and simpler than previously. You can distribute Tableau dashboards with Tableau Desktop and offer them to associates.
Tableau Reader:
It's a free desktop application that empowers you to open and view visualization that is implicit in Tableau Desktop. You can clarify, drill down data yet you can't alter or make any sort of communications.
Tableau Public:
This is a free Tableau software that you can use to make representations with yet you need to save your worksheets or workbooks in the Tableau Server which can be seen by anybody.
Ans: Tableau is a BI device that is intended to assist the client to create graphics and visuals. One can do this with no specialized assistance or prior programming information. Following are some of the key points that help you to understand what is the use of Tableau:
Ans: Following are various data types in Tableau:
String function: These functions like CHAR, ISDATE, ASCII, FIND, LOWER, and so forth, are known as string functions since they work on the string characters or values to control them.
Date Function: We use date functions to apply consistency just as number juggling procedure on date esteems which is present at the data source.
Users can control the data values by utilizing the date functions where it can change the old points, making new ones, or looking through information based on explicit dates.
Some ordinarily utilized date functions in Tableau are TODAY, MONTH, MAKE DATE, DATEADD, ISDATE, MIN/MAX, MAKE TIME, NOW, and so forth
Logical Function: Users use the logical function to perform the relational or logical operations on data in Tableau.
Following are some of the logical functions which are frequently used by the users in Tableau: IFNULL, CASE, ISNULL, IFZN, and so forth
Aggregate Function: Users use an aggregate function to apply conglomeration on data values in various ways.
Some significant aggregation functions which are utilized in Tableau are; MAX, MIN, AVG, PERCENTILE, ATTR, MEDIAN, STDDEV, SUM, and so on
User Function: Users use these functions to deal with the clients who enrolled on Tableau Server or Tableau Online.
Some significant user functions which are utilized in Tableau are: USERNAME, ISFULLNAME, FULLNAME, USER DOMAIN, ISUSERNAME, USERNAME, and so forth
|
Data |
TypeMeaning |
Examples |
|
String |
Character Sequence. Enclosed in ''. |
Tableau', 'World' |
|
Number (Whole) |
Integers |
9 |
|
Number (decimal) |
Floating values. |
123.45 |
|
Boolean |
They are logical values. |
TRUE, FALSE |
|
Date |
Date |
"02/01/2015" |
|
Date & Time |
Date and Time |
01 January 2019 05:55:00 PM |
|
Geographic Values |
Geographical Values |
India, Italy, Canada |
Ans: The logic or design flow in Tableau is as per the following:
Associating with the data source through the connectors accessible in Tableau.
Make data prospects, that is, making representations like graphs, charts, and many more.
Improving the data views utilizing progressed Tableau techniques.
Making various worksheets with the goal that we can have distinctive information from the equivalent or diverse information.
After worksheets, we can make dashboards that are putting together unique and applicable information seen in a solitary view for details.
Utilizing these dashboards or workbook manuals we can make stories to communicate the language of data better.
Ans: Measures are the numeric measurements or quantifiable amounts of the information, which can be broken down by a measurement table. Measures are put away in a table that contains unfamiliar keys alluding exceptionally to the related measurement tables. The table backs information stockpiling at the nuclear level and consequently permits more records to be embedded at one time. For example, a Sales table can have an item key, client key, advancement key, things sold, alluding to a particular occasion.
Dimensions are the graphic quality values for numerous components of each attribute, characterizing various attributes. A measurement table, having reference of an item key structure the table, can comprise of the item name, item type, size, shading, depiction, and many more.
Ans: The data extracts are also known as the subsets of data that you extract from the primary data source. You can optimize Tableaus' speed, performance, and offers that are adaptable to manage large data sets easily using data extracts. You can copy a portion of the data set that is saved in Tableau memory while creating the data extract. Working and overseeing information as such concentrates is a lot simpler than dealing with the whole information from a live association as concentrates are saved disconnected in Tableau's memory.
Ans: Tableau server acts as a centre man between Tableau clients and the information. Tableau Data Server permits you to transfer and share information separates, safeguard data set associations, just as reuse computations and field metadata. This implies any progressions you make to the informational collection, determined fields, boundaries, nom de plumes, or definitions, can be saved and imparted to other people, taking into consideration a protected, halfway oversaw, and normalized dataset. Moreover, you can use your worker's assets to run questions on extricates without having to initially move them to your neighbourhood machine.
Ans: The information blending brings the information from two distinctive data sources together in a solitary view or a solitary Tableau worksheet. For blending the data in Tableau, there are two significant data sources; they are Primary and secondary data sources. The significant information of the auxiliary data source is taken and continued with the principal information of the primary data source and a blended table is represented. Blending is not quite the same as making joins since mixing just consolidates important information from various data sources, though joins work on a column level and frequently copies information that is rehashing in a few lines.
Ans: Sets are custom fields that characterize a subset of information dependent on certain conditions. A set can be founded on a figured condition, for instance, a set may contain clients with deals over a specific limit. Figured sets update as your information changes. Then again, a set can be founded on an explicit information point in your view.
Ans: The custom information views in Tableau are to view that a client can tweak as per their investigation needs. Custom information view is produced using typical information see by making a few adjustments in it or adding progress functionalities and highlights in it. At the end of the day, custom perspectives see that unexpectedly address a bunch of information. Custom information views are substitute perspectives on similar basic information which presents an alternate story in each new view. We can make custom perspectives by making a drill-down measurement with predefined orders. For this situation, each time you drill down the following level, you will discover information at an alternate degree of granularity. Another method of making a custom view is by basically trading the situation of fields or measurements in the Columns or Rows areas. By trading the situation of measurements, you can see your information in another way.
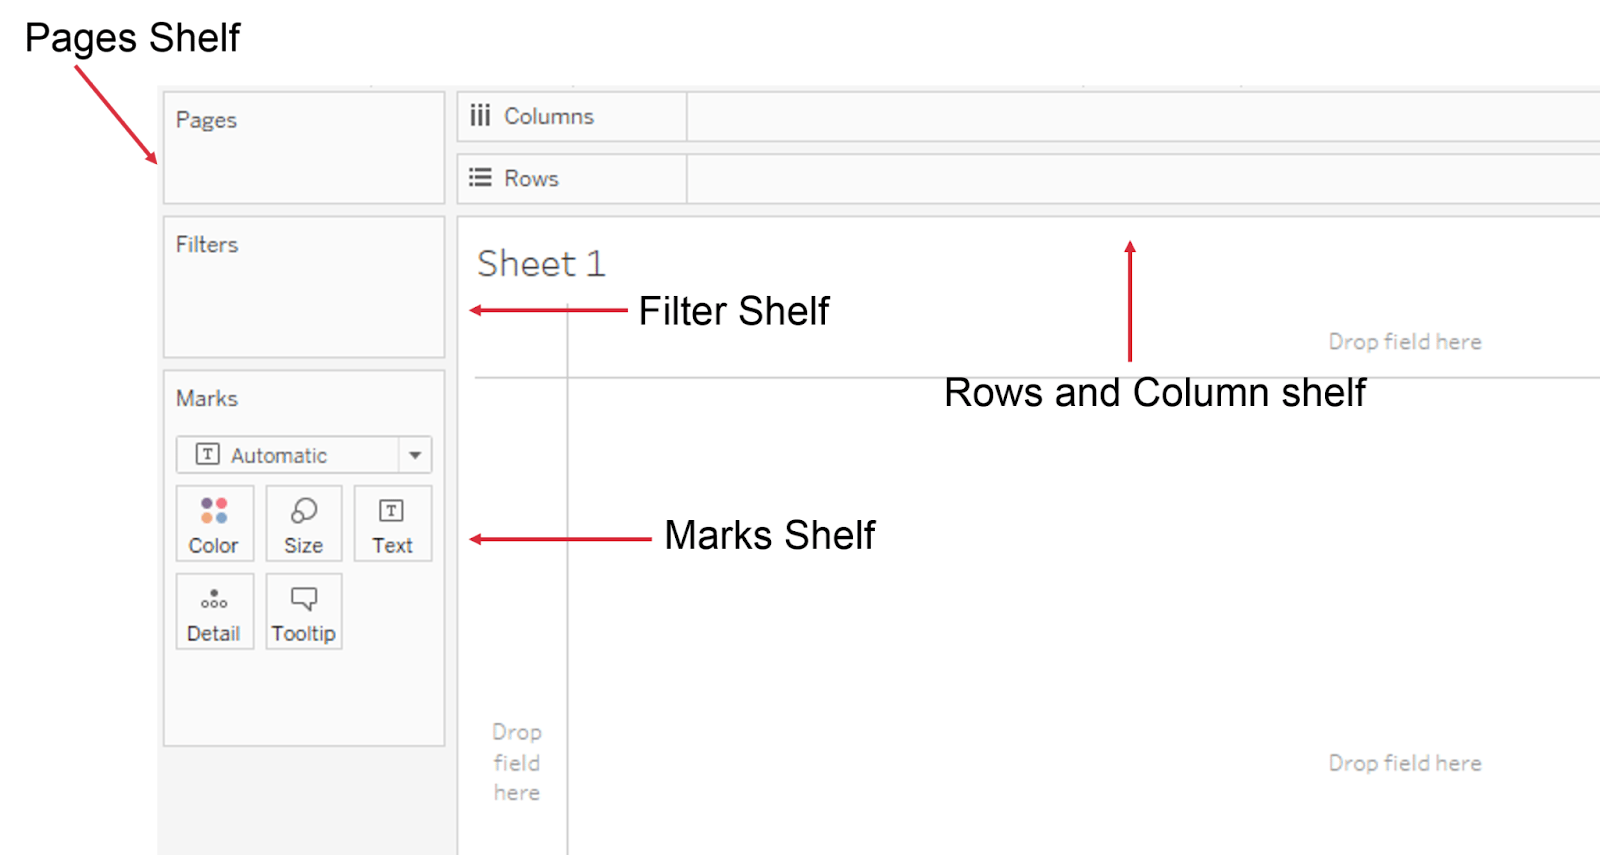
Ans: Each worksheet in Tableau will have Shelves like segments, columns, marks, channels, pages and the sky's the limit from there. By putting channels on shelves you can build your representation structure. You can handle the imprints by including or barring information.
Ans: Combining the information from at least two distinct sources is Data blending, like SQL Server, Excel, and Oracle. In data blending, every information source contains its arrangement of measures and dimensions.
Consolidating the information between at least two tables or sheets inside a similar information source is data joining. All the joined tables or sheets contain a typical arrangement of measures and dimensions.
Ans: In Tableau, filters are utilized to limit the information from the data set.
The various filters in Tableau are: Quick, Context and Normal/Traditional filter are:
An ordinary filter is utilized to limit the information from the data set dependent on chosen measure and dimension. A Traditional Filter can be made by essentially hauling a field onto the 'Channels' rack.
The snappy filter is utilized to view the separating alternatives and channel every worksheet on a dashboard while changing the qualities progressively (inside the reach characterized) during the run time.
Setting Filter is utilized to filter the information that is moved to every individual worksheet. At the point when the worksheet inquiries the information source, it makes a brief, level table that is used to register the graph. This impermanent table incorporates all qualities that are not sifted through by either the Custom SQL or the Context Filter.
Ans: Whenever you make a Context Filter, Tableau will make a brief table for this specific Filter set and different Filters will be applied to the Context Filter information like course boundaries.
Assume, you made a Context Filter on nations, USA and India, Tableau will make a brief table for these two nations' information and on the off chance that you have some other Filters other will be applied to these two nations' information if you don't have any Context Filter, each record will check for all Filters.
Ans: The Context Filter isn't as often as possible changed by the client—if the Filter is changed, the data set should be recomputed and the transitory table must be reworked, easing back execution.
At the point when we set measurement to the setting, Tableau makes an impermanent table that will require a reload each time the view is started. For Excel, Access, and text information sources, the transitory table made is in an Access table arrangement. For SQL Server, MySQL, and Oracle information sources, we should have consented to make an impermanent table on our worker. For a multidimensional information source, or solid shapes, impermanent tables are not made, and Context Filters characterize which Filters are free and which are needy.
Ans: Fields are the most significant component in managing data as well as analyzing it.
All the data values are classified and managed accordingly in the fields of distinct data tables.
In Tableau, you can perform various operations on the data fields like:
Ans: Tableau Data Engine is a truly cool component in Tableau. It's a scientific information base intended to accomplish moment inquiry reaction, prescient execution, coordinate consistently into existing information frameworks, and isn't restricted to stack whole informational collections into memory. If you work with a lot of information, it does take some effort to import, make files, and sort information yet after that everything speeds up. Scene Data Engine isn't in-memory innovation. The information is put away in the circle after it is imported and the RAM is not used.
Ans: Tableau Data Extracts are depictions of information advanced for total and stacked into framework memory to be immediately reviewed for representation.
Instance: Hospitals that screen approaching patient information need to settle on ongoing choices.
Live connections offer the comfort of continuous updates, with any adjustments in the information source reflected in Tableau.
Instance: Hospitals need to screen the patient's week by week or month to month drifts that require information extricates.
At the point when you concentrate the information, Tableau needn't bother with admittance to the data set to fabricate the perception, so preparing is quicker.
If you have a Tableau worker, the concentrate choice can be set to a revived schedule to be refreshed.
Ans: A parameter is a unique worth that a client could choose, and you can utilize it to supplant steady qualities in computations, filters, and reference lines.
For instance, while making a filter to show the best 10 items dependent on absolute benefit rather than the fixed worth, you can refresh the filter to show the best 10, 20, or 30 items utilizing a parameter.
Proceeding with a similar illustration of top-five and base five clients, follow these means:
Select the drop-down bolt on the upper right corner of the Datasheet.
Snap-on Create Parameter and fill in the subtleties:
Alter the set 'Top Customers' by evolving the 'By Field' estimation of 5 with 'Select number of top/base clients.' Do similar changes in the 'Base Customers' set.
Go to the mode parameter on the Datasheet, right-click on it and select 'Show Parameter Control.' Now, if you increment the progression inside the reach, the information shows up according to the parameter esteem set.
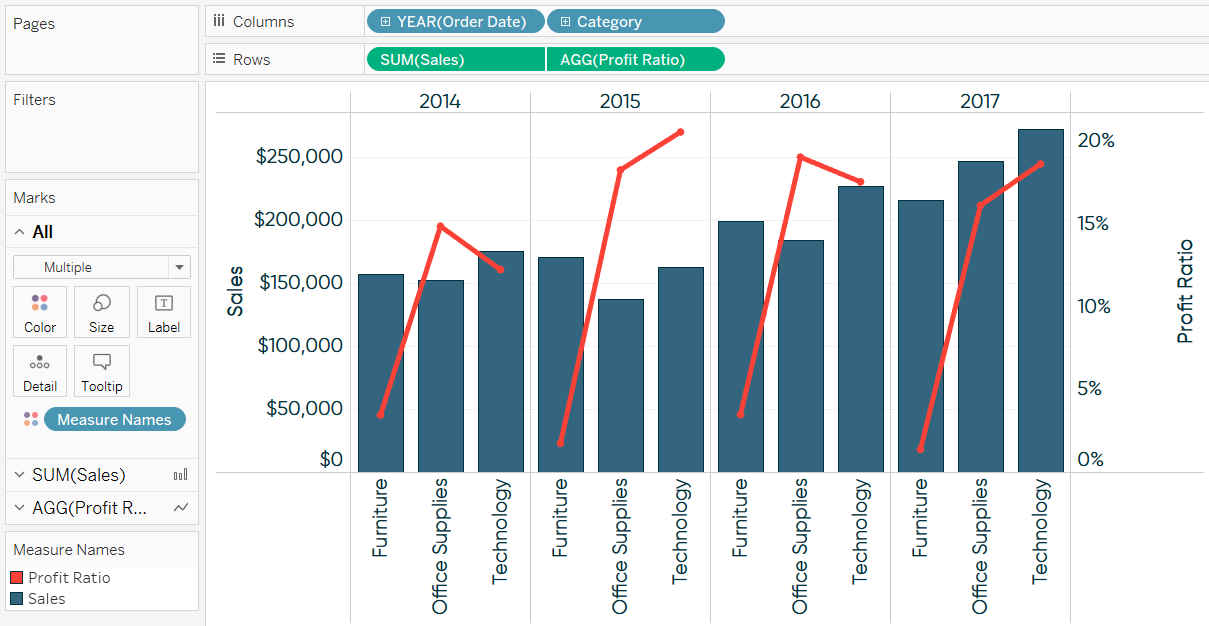
Ans: Dual Axis is a fantastic wonder upheld by Tableau that assists clients with reviewing two sizes of two measures in a similar chart. Numerous sites like Indeed.com and others utilize dual-axis to show the correlation between two measures and their development rate in a septic arrangement of years. Dual axes let you look at various measures without a moment's delay, having two autonomous axes layered on top of each other. This is what it looks like:
Ans: Data modelling is the analysis of data objects that are utilized in a business or other setting and utilized as distinguishing proof of the connections among these data objects. It is an initial step of doing object-oriented programming.
Ans: The method of viewing numeric points or measures at higher and more summed up levels of the information is called total. At the point when you place a measure on a rack, Tableau consequently totals the information, for the most part by adding it. You can undoubtedly decide the collection applied to a field because the capacity consistently shows up before the field's name when it is put on a rack. For instance, Sales become SUM(Sales). You can total estimates utilizing Tableau just for social information sources. Multidimensional information sources contain totalled information as it were. In Tableau, multidimensional information sources are upheld just in Windows.
As per Tableau, Disaggregating your information permits you to see each line of the information source which can be helpful when you are investigating estimates that you might need to utilize both freely and conditionally in the view. For instance, you might be breaking down the outcomes from an item fulfilment review with the Age of members along one hub. You can total the Age field to decide the normal period of members or disaggregate the information to figure out what age members were generally happy with the item.
Ans: Tableau gives us the choice to Quick Sort information present in our representations. You can quickly sort information from the perception by essentially tapping on the sort button present on the tomahawks of a diagram or graph. An ascending sort is performed upon a single tick, the plunging sort is performed on two ticks and an applied sort is cleared on three ticks on the Quick Sort symbol.
Ans: The various hierarchical fields are those which have information orchestrated in hierarchies. Hierarchies of importance sort out pertinent information on various levels. We can jump profound into information and investigate it at a better level by doing a drill-down into hierarchical fields.
Ans: Histograms show or graphically describe the conveyance of qualities in stretches or receptacles of equivalent sizes. These outlines are explicitly used to address the dispersion of consistent information. Histograms permit us to do a factual investigation of business-related boundaries like deals, benefit, misfortune, amount sold and so forth. Such amounts go under the classification of nonstop measures. To make a histogram, Tableau takes the ceaseless measure esteems and places them into bins of equivalent sizes.
Bins are only arrangements of significant worth reaches like 0-5, 5-10, 10-15, etc. The measure esteems relating to these reaches fall into their reach.
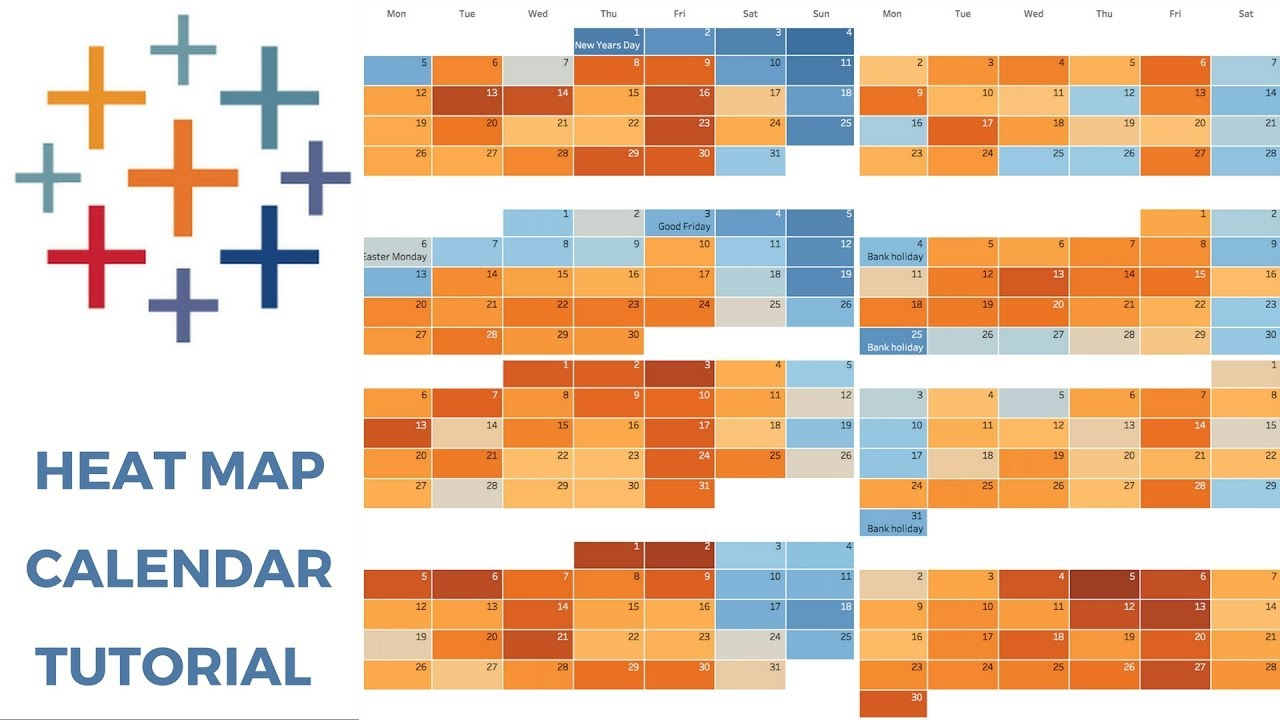
Ans: The Tableau heat map shows information esteems as thickness spots or heat spots on a guide.
A Heat map is otherwise called a concentration heat map as it shows huge detects whose force and shade shift depend on the number of qualities in a group of qualities. The more the quantity of qualities in a group, the higher it is and appeared with a dull tone on the guide. Subsequently, we can utilize density heat guides or heat guides to break down territories with densely or inadequately populated information.
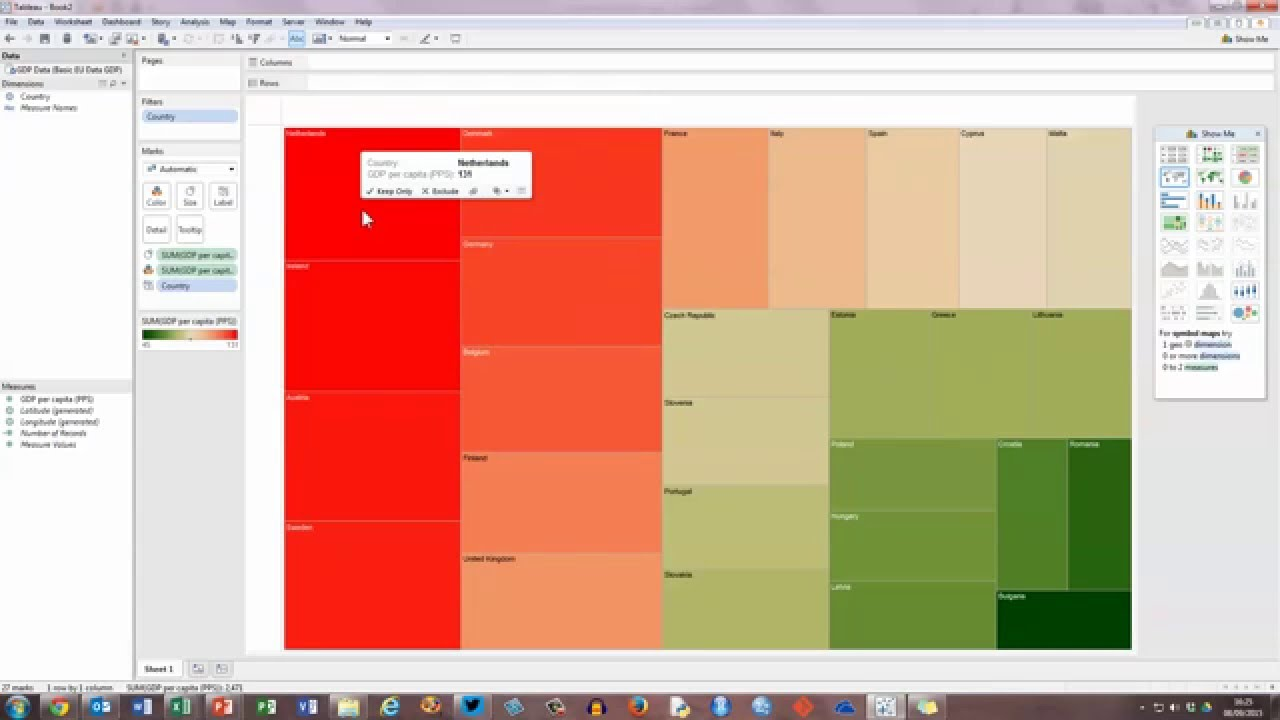
Ans: A TreeMap is an outline type utilized in Tableau to graphically represent the information. The treemap graphs show the information in a section to the entire way for example you will perceive how individual parts make up the entirety. For instance, if we see that most of the deals happened in the Phone portion in a gadgets store. A treemap graph can show you a greater square shape for the Phone portion and afterward various little square shapes inside the huge square shape showing the deals of various brands like OnePlus, iPhone, Oppo, Samsung, Pixel, and so forth Thus, treemaps address multi-layered information in a section the entire way. It comprises rectangular boxes of various sizes. The size of the crates is straightforwardly corresponding to the information esteem for example greater the worth, bigger the container. The treemap graph is shaded and it relegates unmistakable tones to various arrangements of qualities.
Ans: A Column chart represents the information as a bunch of square shape sections, as their lengths are relative to values when they represent the information. The horizontal hub shows the classification to which they have a place, and the vertical pivot shows the qualities.
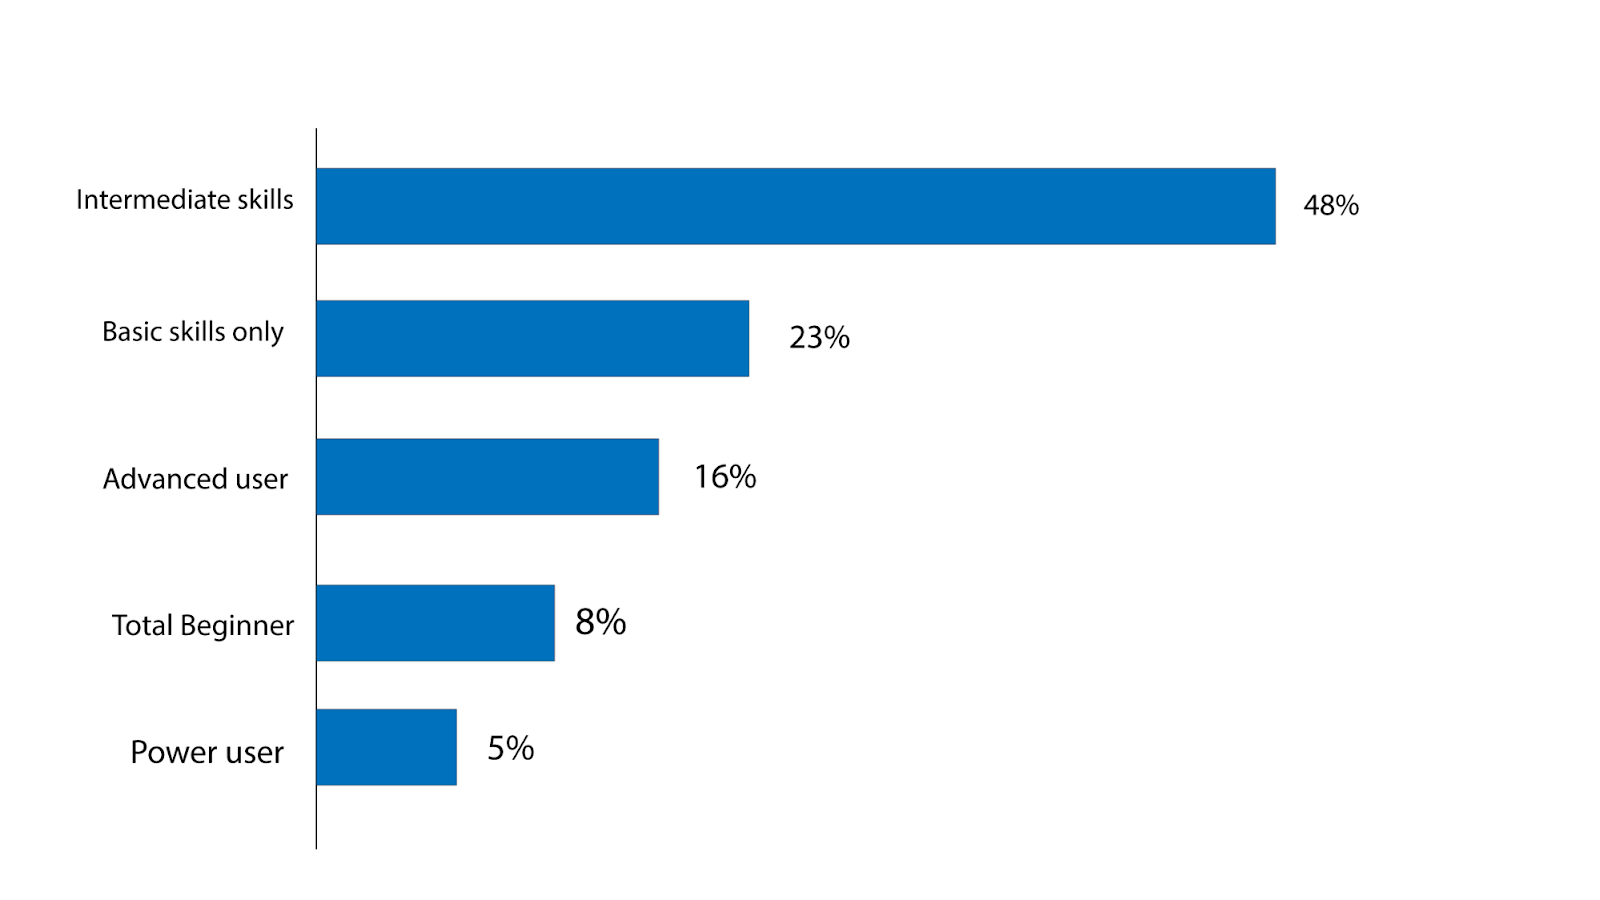
Ans: The bar chart represents the information as a set of square shape bars, as their qualities are corresponding to lengths when they address the information. The vertical hub shows the class to which they have a place with and the flat pivot shows the qualities. Thus, the bar diagram is a vertical rendition of the Column chart.
Ans: The line chart is a mainstream kind of diagrammatic route for envisioning the information, it interfaces the individual information focuses to see the information. We can undoubtedly picture the arrangement of qualities, we can see patterns over the long run or anticipate future qualities. The horizontal axis holds the class to which it has a place and the vertical axis holds the qualities.
Ans: Stacked Bar Chart, made out of various bars stacked evenly, one beneath the other. The length of the bar relies upon the incentive in the information point. Stacked bar graphs make the work simpler, they will assist us with knowing the adjustments altogether factors introduced, one next to the other. We can watch the adjustments in their aggregate and conjecture future qualities.
Ans: Stacked Column Chart, made out of various bars stacked vertically, one on another. The length of the bar relies upon the incentive in the information point. A stacked segment graph is the best one to know the adjustments on the whole factors. This kind of diagram ought to be checked when the various arrangements are higher than two.
Ans: A Waterfall chart shows the progressive change of information esteems from beginning to end. It addresses a running all out with progressive increment and abatement occurring in the middle of the beginning point and endpoint. In a typical running aggregate, we can't perceive how singular classifications are adding to the entire or aggregate. Utilizing a waterfall chart, we dissect how every classification's positive qualities increment the complete worth and the negative qualities decline the absolute worth. Such good and bad times lead to a resultant last worth. What's more, this is the thing that we dissect in a waterfall diagram. This takes into consideration a sagacious examination in Tableau of how singular components of dimensions are measures add to bringing a complete estimation of a chart.
Ans: The area graph is only a line visit, the area between x-pivot and lines will be shading or examples. These graphs are regularly used to address collected aggregates over the long run and are the traditional method to show stacked lines.
Ans: Tableau bins are practically equivalent to holders that are of equivalent size and that store information esteems compared to the bin size.
The bins bunch a set of information into gatherings of equivalent size. This gives an orderly appropriation of information.
In Tableau, we can take information from any discrete field and make bins. Even though Tableau clients for the most part use measure fields to make numeric bins.
Bins are valuable in information examination as they give an efficient information range that encourages us to put together data better and find designs without any problem. Bins are made by utilizing determining fields in Tableau.
Ans: The Pivot highlight in Tableau permits us to switch the lines with segments in a table. For example, we should envision a situation where we have five meeting up-and-comers and we pose 10 inquiries from every last one of them. Presently, when we make a typical table to store this information, we should make 10 sections for every competitor. This will make our table strangely huge. To forestall this, we can pivot the fields in the table and we have a solitary measure section that will store the score and incentive for each question relating to every competitor as opposed to having ten segments of up-and-comer score. This is how turning works in Tableau as it is normally utilized in situations where we need to make the information investigation and representation simple.
Ans: Forecasting is an interaction of showing future patterns by distinguishing customary examples of existing information esteems. The method of distinguishing standard examples from existing information esteems is known as outstanding smoothing. Scene utilizes dramatic smoothing and gives a precise figure chart that they can use in the prescient investigation. Forecasting in Tableau depends on two significant ideas for example Patterns and Seasonality. A pattern is the increment or diminishing in information over the long haul and irregularity is a rehashing variety in qualities over a decided or fixed timeframe (like week after week, quarterly, yearly, and so on) These are known as seasons. These occasional and rehashing varieties are unsurprising giving us exact figures for prescient investigation.
Ans: Following are some of the significant points that help the tableau to increase the performance:
Ans:
.twb
The .twb contains guidelines about how to connect with the information source. At the point when it structures a perception, Tableau will take a gander at the information source and afterwards construct the representation with a concentrate. It can't be shared alone as it contains just guidelines, and the information source should be joined independently.
.twbx
The .twbx contains the entirety of the important data to assemble the perception alongside the information source. This is known as a bundled exercise manual, and it packs the bundle of records inside and out.
Ans: Yes, we can do it. But for better performance, we should use Extract.
Ans: If the server license expires today, the username on the server will have the role ‘unlicensed’ which means it cannot access but others can. The site admin can change the ownership to another person so that the extracts do not fail.
Ans: To add custom colour in Tableau, you need to follow 3 steps
You liked the article?
Like: 0
Vote for difficulty
Current difficulty (Avg): Medium

TekSlate is the best online training provider in delivering world-class IT skills to individuals and corporates from all parts of the globe. We are proven experts in accumulating every need of an IT skills upgrade aspirant and have delivered excellent services. We aim to bring you all the essentials to learn and master new technologies in the market with our articles, blogs, and videos. Build your career success with us, enhancing most in-demand skills in the market.