Introduction to MicroStrategy Architect
MicroStrategy Architect is a project design tool. Architect allows you to define all the required components of your project from a centralized interface. An architect also provides a visual representation of your project as you create it, which helps to provide an intuitive workflow.
With Architect you can perform all tasks related to initial project creation as well as modifications required over the full life-cycle of a project. Architect provides a single integrated environment in which you can make project-wide changes as well as create or modify multiple schema objects at the same time. An architect also allows you to add tables to your project and create or modify attributes, facts, and user hierarchies all from the same interface.
Modifying your project using Architect also allows you to lock the schema of your project, preventing users from encountering reporting issues or returning outdated data during periods of scheduled project maintenance.
Project Layers
A MicroStrategy project can be considered to be divided into three layers:
Schema layer: The schema layer is comprised of four key objects:
• Facts: Facts relate numeric data values from the data warehouse to the MicroStrategy reporting environment. Facts generally represent the answers to the business questions on which users want to report.
• Attributes: Attributes provide the business model with a context in which to
• Tables: Tables are logical representations of physical database tables.
• Transformations: Transformations can be used to perform time-series analysis. Transformations are schema objects created using attributes in your project.
The schema layer of a project is built using MicroStrategy Architect.
Business abstraction layer: This layer is comprised of four key objects:
• Metrics: Metrics represent business measures that are analytical calculations to be performed on data from a relational database. A metric equation is generally made up of facts plus arithmetic operators.
• Filters: A filter qualifies the report content and represents the conditions
• Templates: Templates specify the information to be retrieved from the database and its layout, formatting, and presentation.
• Prompts: Prompts provide user interaction by allowing them to choose information before the report is executed. Prompts allow users to define the report, thus allowing the resulting display to be dynamic.
The business abstraction layer is built using MicroStrategy Desktop or MicroStrategy Web.
Reporting layer: The reporting layer is comprised of reports and documents (such as dashboards), which are built using objects from the schema layer and the business abstraction layer.
The reporting layer is built using MicroStrategy Desktop or MicroStrategy Web.
Inclined to build a profession as MicroStrategy Developer? Then here is the blog post on, explore MicroStrategy Training
Features
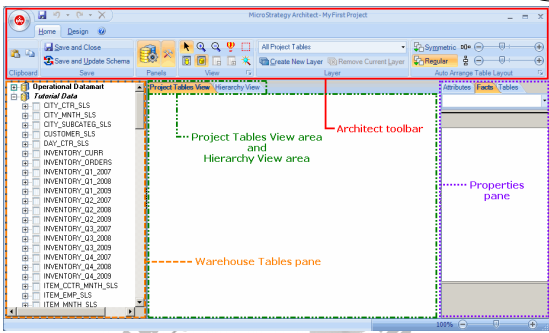
Architect displays with the following features, which are shown in the image below:
- Warehouse Tables pane: In this pane, project designers can access the data warehouse and select the tables containing data to be made available for the project. This area provides a real-time view of the data source, giving the project designer the ability to update table structures as you build the project.
- Project Tables View area: In this area, a project designer can abstractly warehouse tables into physical representations in the MicroStrategy metadata repository, where MicroStrategy objects are stored. Project designers can define attributes and facts based directly on a given warehouse table.
- Hierarchy View area: In this area, a project designer can group attributes logically into hierarchies. This area provides a real-time view of the project model, allowing designers to build attributes in the Project Tables View area and combine them into logical groups in the Hierarchy View area.
- Properties pane: In this pane, project designers can view various details about the current object selected, as well as modify the object.
- Architect toolbar: This set of toolbar icons facilitate the tasks of creating and modifying a project. To review detailed information on each toolbar option, with Architect open, press F1 to open the Architect online help and search for the topic Architect: Toolbar options.
Facts Creation in Architect
- From the Project Tables View, locate and select the table that includes a column or columns to use in a fact definition.
- Right-click the table and select Create Fact. A dialog box opens to name the fact.
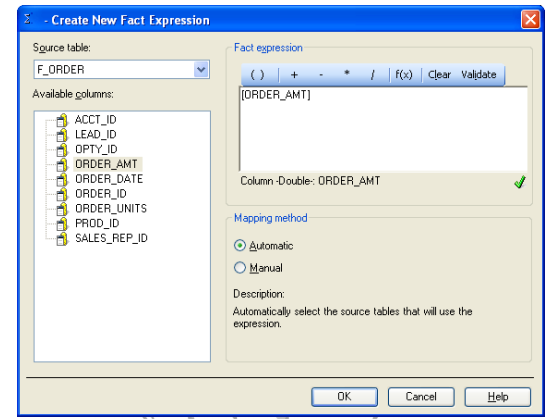
- Type a name for the fact, and click OK. The Create New Form Expression dialog box opens to create a fact expression.
- From the Available columns pane, drag and drop a column into the Form expression pane.
- In the Mapping area, select Automatic or Manual:
a. Automatic mapping means that all of the tables in the project with the columns used in the fact expression are selected as possible source tables for the fact. You can then remove any tables mapped automatically and select other tables.
b. Manual mapping means that all of the tables in the project with the columns used in the fact expression are located but are not selected as possible source tables for the fact. You can then select which of those tables are used as source tables for the fact.
6. Click OK to close the Create New Form Expression dialog box and create the fact. The fact is displayed in the table used to create the fact.
MicroStrategy Advanced Interview Questions
Attributes Creation in Architect
- From the Project Tables View, locate and select a table that includes a column or columns to use in an attribute definition.
- Right-click the table and select Create Attribute. A dialog box opens to name the attribute.
- Type a name for the attribute, and click OK. The Create New Form Expression dialog box opens.
- Create a form expression for the ID form of the new attribute being created.
- Click Validate to ensure that your expression is valid.
- Select the Mapping method either Automatic or Manual.
- Click OK to close the Create New Form Expression dialog box and create the attribute. The attribute is displayed in the table used to create the attribute.
Attribute Relations in Architect
After you have created attributes for your project, you can define attribute relationships to determine how the engine generates SQL, how tables and columns are joined and used, and which tables are related to other tables.
You link directly related attributes to each other by defining parent-child relationships. The parent-child relationships that you create determine the system hierarchy within the project. The four types of direct relationships that can exist between attributes include one-to-one, one-to-many, many-to-one, and many-to-many.
1. From the Hierarchy View, on the Home tab, in the drop-down list on the Hierarchy area of the toolbar, select System Hierarchy View. The system hierarchy is displayed.
2. Before defining any relationships, you should gather the attributes that you want to relate to each other in the same area within the Hierarchy View of the Architect. For example, the attributes Year, Quarter, Month of Year, Month, and Day are gathered close together in the Hierarchy View, as shown below
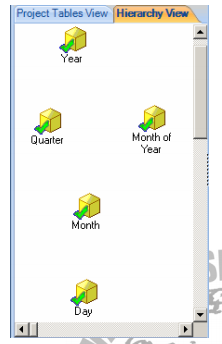
3. Select an attribute that is to be a parent attribute in an attribute relationship. Drag from the middle of the attribute to an attribute that is to be a child of the parent attribute selected. A one-to-many relationship line is created between the two attributes. For example, in the image below a relationship is created between the Year and Quarter attributes in which Year is a parent attribute of Quarter.
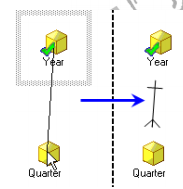
In the example above, the Year attribute is the parent attribute of Quarter.
4. Attribute relationships created in this way are created as one-to-many relationships by default. To modify the relationship type, right-click the relationship line, and select from one of the relationship types.
User hierarchies in Architect
- User hierarchies provide flexibility in element browsing and report drilling. They are groups of attributes and their relationships to each other, arranged in ways that make sense to a business organization.
- From the Hierarchy View, select an attribute to include in the hierarchy, and then click the New Hierarchy toolbar option. A dialog box to name the hierarchy opens.
- Please enter the hierarchy name field, type a name for the hierarchy, and click OK. You are returned to Hierarchy View with the attribute you selected included in the hierarchy.
- To add additional attributes to the hierarchy, right-click within the Hierarchy View and select Add/Remove Attributes to Hierarchy. The Select Objects dialog box opens.
- In the Available objects pane, select the attributes to use in the hierarchy and click the arrow to add them to the Selected objects pane.
- Click OK to close the Select Attributes dialog box and return to Architect. The attributes you selected appear in Hierarchy View.
- To create a browsing or drilling relationship, locate an attribute that is to be able to browse to and/or drill to another attribute. Drag from the middle of the attribute to another attribute. Browsing and/or drilling relationship is created between the two attributes.
- To use the hierarchy as a drill hierarchy, right-click within the Hierarchy View and select Use As a drill hierarchy. If you clear this checkbox, the hierarchy is only used for browsing.
- From the Home tab, click Save and Close to save your changes and close Architect.
- You can save user hierarchies in any folder. However, to make the user hierarchy available for element browsing in the Data Explorer, you must place it in the Data Explorer sub-folder within the Hierarchies folder.
Update Project Schema
All of the schema objects—facts, attributes, hierarchies, transformations, and so on—in your project come together to form your project’s schema. the project schema refers to an internal map that MicroStrategy uses to keep track of attribute relationships, fact levels, table sizes, and so on within the project.
Whenever you make any changes to a schema object you must indicate to MicroStrategy that new schema object definitions have been included and that these definitions need to be loaded into memory.
1. In MicroStrategy Desktop, from the Schema menu, select Update Schema.
2. In the Schema Update dialog box, select or clear the following checkboxes:
a. Update schema logical information: Use this option if you added, modified, or deleted a schema object.
b. Recalculate table keys and fact entry levels: Use this option if you changed the key structure of a table or if you changed the level at which a fact is stored.
c. Recalculate table logical sizes: Use this option to use MicroStrategy Desktop’s algorithm to recalculate logical table sizes and override any modifications that you have made to logical table sizes.
d. Recalculate project client object cache size: Use this option to update the object cache size for the project.
3. Click Update.
Additional Concepts in Architect
Partition Mapping
- Partition mapping involves the division of large logical tables into smaller physical tables; this division is based on a definable data level, such as month or department. Partitions improve query performance by minimizing the number of tables and records within a table that must be read to satisfy queries issued against the warehouse. By distributing usage across multiple tables, partitions improve the speed and efficiency of database queries.
- Time is the most common category for partitioning databases. Partitioning by time limits the growth of the database tables and increases stability.
- Partitioning can be managed by either the database server (Server-level Partitioning) or the MicroStrategy application (Application-level Partitioning).
- In application-level partitioning, the application, rather than the RDBMS server, manages the partition tables. A partition base table (PBT) is a warehouse table that contains one part of a larger set of data. Partition tables are usually divided along logical lines, such as time or geography.
Transformations
- A transformation is a schema object that typically maps a specified time period to another time period, applying an offset value, such as the current month minus one month. Transformation-style analysis can also be supported using the Lag and Lead functions provided with MicroStrategy. These functions can be used to define metrics that compare values from different time periods without the use of transformations.
- Any transformation can be included as part of the definition of a metric and multiple transformations can be applied to the same metric.
Transformation Components:
All transformations have the following components:
1. Member attributes: This component contains the attributes to which the transformation applies, that is, the different levels to which the rule applies.
2. Member tables: These tables store the data for the member attributes.
- For an expression-based transformation, each member expression is based on a specific table, generally the lookup table corresponding to the attribute being transformed.
- For a table-based transformation, this is the transformation table defining the relationship.
3. Member expressions: Each member attribute has a corresponding expression.
- For an expression-based transformation, this is a mathematical expression. In the most generic case, this expression uses constants, arithmetic operators, mathematical functions, and columns from the warehouse, typically the attribute ID column.
- For a table-based transformation, this is simply a column from a specific warehouse table specifically populated with data supporting the transformation.
Mapping type: This component determines how the transformation is created based on the nature of the data. The mapping can be one of the following:
- One-to-one: A typical one-to-one relationship is “last year to this year.” One day or month this year maps exactly to one day or month from last year.
- Many-to-many: A typical many-to-many relationship is year-to-date. For one date, many other dates are included in the year-to-date calculation.
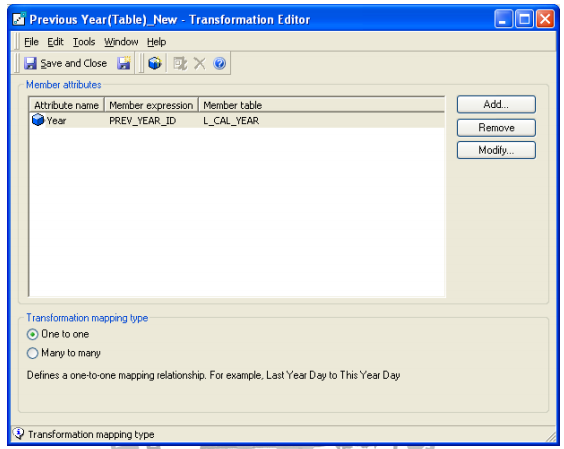
Table based Transformation:
- Log in to the project source that contains your project in MicroStrategy Desktop and expand your project.
- From the File menu, point to New, and select Transformation. The Transformation Editor opens with the Select a Member Attribute dialog box displayed.
- Double-click Time to open the folder, then double-click Year. The Year - Define a new member attribute expression dialog box opens.
- Select the LU_Year table from the Table drop-down list. The table's columns appear in the Available columns list. Notice that this table contains a previous year column, which maps this year to last year.
- Double-click the PREV_YEAR_ID column to place it in the expression box.
- Click OK.
- Click Save and Close on the toolbar. Name the transformation Last Year (Table).
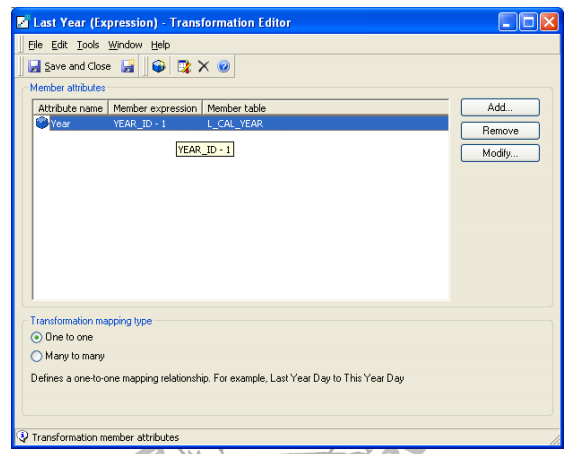
Expression based Transformation:
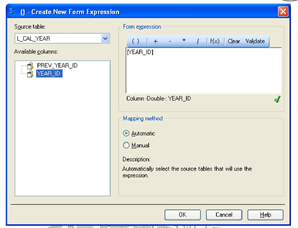
- In MicroStrategy Desktop, from the File menu, point to New, and select Transformation. The Transformation Editor opens with the Select a Member Attribute dialog box displayed.
- Double-click Time to open the folder, then double-click Year. The Year - Define a new member attribute expression dialog box opens.
- Select the LU_Year table from the Table drop-down list. The table's columns appear in the Available columns list.
- Double-click the YEAR_ID column to place it in the expression box.
- Type -1 in the expression box. The transformation will subtract 1 from the Year ID to calculate last year’s ID.
- Click Validate. The message “Valid expression” appears with a green checkmark.
- Click OK.
- Click Save and Close on the toolbar. Name the transformation Last Year (Expression).
For an in-depth understanding of MicroStrategy click on


