Working with dates in Tableau differes depending on whether you are using a Relational or Multidimensional Data Source. This section below discusses these differences.
For multidimensional data sources, dates dimensions are usually organized into hierarchies that contain levels such as year, quarter, and month. In addition, some multidimensional data sources have time intelligence enabled, which enables different ways to look at these data levels such as Months by Year, Months by Quarter, Weekends, etc. These are represented as attributes of the hierarchy. These hierarchies and attributes are defined when the cube is created and you cannot modify them in Tableau. For example, the Year dimension from an Oracle Essbase data source is shown below.

When you place a multidimensional date on a shelf, the field is treated like any other dimension. For example, you can drill down, drill up, and so on.
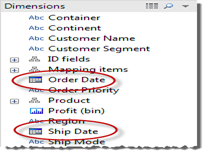
For relational data sources, dates and times are automatically placed in the Dimensions area of the Data window and are identified by the icon. For example, the Order Date and Ship Date dimensions from an Excel data source are shown below.
When you place a relational date on a shelf, the field name is automatically modified to reflect the default date level. Tableau defines the default date level to be the level at which there are multiple instances. For example, if the date field includes multiple years, the default level is year. However, if the date field contains data for just one year but includes multiple months, then the default level is month.
These core tutorials that helps you to learn the fundamentals of Dates and Times in Relational
 and Multidimensional DataSources in Tableau. For in-depth knowledge and practical experience
explore Tableau Training.
If you don’t want Tableau to automatically select a date level and would rather have a date dimension be a continuous field, you can right-click the field in the Data window and select Convert to Continuous. The dimension turns green in the Data window and anytime you use the field it will be continuous. You can easily revert back by selecting Convert to Discrete from the field’s context menu in the Data window. You can also convert a single field to continuous while it is on a shelf by selecting Continuous on its field menu. The field on the shelf turns green but the field in the Data window is still discrete.
For both relational and multidimensional data sources, you can change the date level using the field’s context menu after dragging it to a shelf. For multidimensional dates, the levels available in the context menu are given by the levels defined in the date hierarchy. For relational dates, you can select between the discrete date levels at the top of the menu or the continuous date at the bottom. A preview of each date level is shown. Below is the field menu for a relational date with the discrete Quarter level selected.

For relational dates, there are many different date levels available, as shown above. When you select a particular level, Tableau asks the data source to perform a computation on the date field. For example, suppose a particular row in your data source has a date entry of 01/23/07. The year is 2007, the quarter is 1 because January falls in the first quarter, and the week number is 4 because January 23rd falls in the fourth week. How the date level is computed depends on your data source because the computation is actually being done by the data source. Therefore, if your data source is configured to use a specific standard to compute week number, Tableau will use the same standard.
Note that some date levels might not make sense for your relational data source. For example, if the date format does not include time information such as hour, minute, or second, then selecting one of these options will not add any data to your view.
You can work with dates at varying levels of detail simultaneously. To do so, you can drill into dates by clicking the control. You can also drag date fields to the Rows or Columns shelf multiple times in order to nest them and to drill down into them at varying levels of detail.
For example, the view shown below drills down into the year level to display the quarter level as well.

You can display the data by month by selecting Month from the date field’s context menu. This displays the data for each month across all years.
To display finer granularity, you can select the MMMM YYYY level from the field menu. Tableau displays the dates using the month and the year.
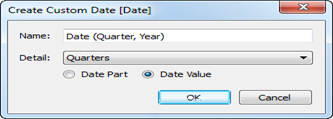
You can create a custom date that is binned or truncated to a specific level. The custom date becomes a new field in the Data window. Custom dates are useful if you always use a date at a specific level or you want to create calculations that rely on a binned or truncated date. Custom dates can also be created using the DATEPART and DATETRUNC functions in a calculated field. Follow the steps below to create a custom date:
Occasionally a date field needs to be expressed in terms of its fiscal date equivalent. For instance, calendar years always run from January 1st until December 31st. But an organization’s fiscal year might start on a month other than January. For instance, a company’s fiscal year might run from June 1st in one year through May 31st of the following year. In these cases, it’s helpful to express the Fiscal Year and the Fiscal Quarter and the Fiscal Week Number rather than their calendar equivalents, when using the date field in a view.
To express date fields in fiscal terms, follow these steps:
Whether a given level of a date dimension is affected by the conversion to a fiscal equivalent depends on the specific case. Consult the following table:
| Date Level | When Converted to Fiscal |
| YEAR | The YEAR reflects the fiscal year. For instance, the year for the date June 1, 2004 would be shown as FY 2005. |
| QUARTER | The QUARTER reflects the fiscal quarter. For instance, the quarter for the date June 1, 2004 would be shown as Q1. |
| MONTH | No change in behavior. The calendar month is the same as the fiscal month. |
| DAY | No change in behavior. The calendar day is the same as the fiscal day. |
| HOUR | No change in behavior. The calendar hour is the same as the fiscal hour. |
| MINUTE | No change in behavior. The calendar minute is the same as the fiscal minute. |
| SECOND | No change in behavior. The calendar second is the same as the fiscal second. |
| WEEKNUMBER | The WEEKNUMBER reflects the fiscal week number. For instance, the week number for the date June 1, 2004 would be shown as 1. |
| WEEKDAY | No change in behavior. The calendar weekday is the same as the fiscal weekday. |
| MM/YYYY | No change in behavior. This date format always displays calendar dates, even when a fiscal year has been assigned. |
| M/D/Y | This date format always displays Calendar dates, even when a fiscal year has been assigned. |
Notice that the only date level that expressly displays the conversion to a fiscal calendar is the YEAR level. Specifically, fiscal years are shown with the FY prefix. This is not true of fiscal quarters or week numbers, however, which are not shown with any special fiscal markings.
Fiscal year designations for any given date dimension are applied to all instances of the field in the Tableau workbook. Fiscal dates can only be applied to dimensions in a relational data source.
You can perfect pivot dates by placing different date levels on different worksheet shelves simultaneously. Place the date field on a variety of shelves and then select the desired date level from the fields’ context menus.
For example, the following line chart displays years as column headers and then color-encodes the marks by quarter.

You can separate the marks by month and by quarter as shown below.

You can treat a date as a continuous quantity after placing the field on a shelf. You do this by selecting on of the Continuous date options on the field’s context menu (lower list of date levels). Continuous dates draw a quantitative axis for the date values.
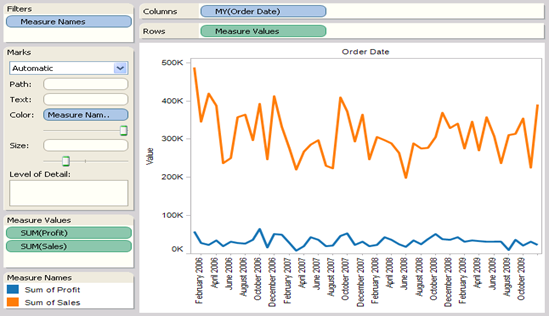
For example, the view below displays the sales as a function of a continuous order date and color-encoded by department. As you can see, the color of the Order Date field changes from blue to green after it is converted to a continuous quantity.
Treating dates as a continuous quantity is particularly useful when you use Gantt bars or want to see trends using line charts as shown above.
By default, date dimensions are discrete fields for which Tableau automatically selects a date level when it is placed on a shelf. You can make a date dimension continuous by default by right-clicking the field in the Data window and selecting Convert to Continuous. The field turns green and is automatically converted to a continuous field when you drag it to a shelf. To revert to discrete again, right-click the field in the Data window and select Convert to Discrete.
For indepth knowledge on Tableau, click on below
You liked the article?
Like: 0
Vote for difficulty
Current difficulty (Avg): Medium

TekSlate is the best online training provider in delivering world-class IT skills to individuals and corporates from all parts of the globe. We are proven experts in accumulating every need of an IT skills upgrade aspirant and have delivered excellent services. We aim to bring you all the essentials to learn and master new technologies in the market with our articles, blogs, and videos. Build your career success with us, enhancing most in-demand skills in the market.

