SAP Lumira is a data manipulation and visualization tool. You can connect to various data sources, select and clean data, and manipulate and visualize data with a diverse offer of graphical charts and tables. SAP Lumira is installed locally and can operate on data either remotely or on locally stored datasets. The charts that are created can be saved and sent out by email. Your datasets can be published to SAP Hana, SAP Explorer, the SAP Lumira Cloud, and SAP Streamwork activities. The charts that you create in SAP Lumira are saved in documents with the file format.SViD. This is a document that contains the data source connection information, the data definition and data, and the visualizations.

Click on New Document


| Want to acquire industry skills and gain complete knowledge of SAP BASIS? Enrol in Instructor-Led live SAP BASIS Training to get Job Ready! |


Acquire a dataset from a universe
Create a New Document

Select Universe

Design Query.

Acquire a dataset from a database using Freehand SQL
Create a new document


Provide details
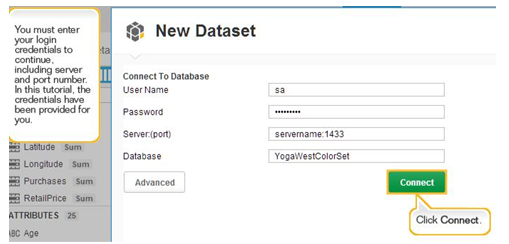
Select the Source table & Write Query


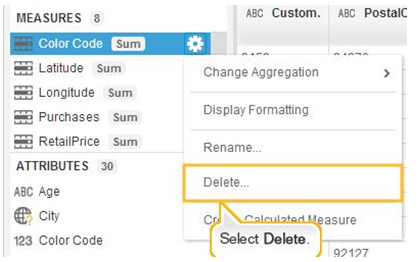
1) Manage measures in a dataset
Execute Query

Delete column

Create a measure


Sort, rank, calculate, and filter values in a visualization
Execute any Query

Select any measure & set the order


Can calculate


Sharing Results
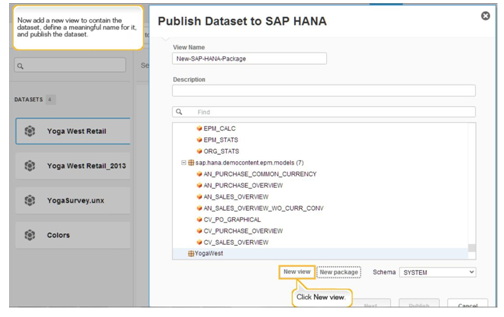
Export a dataset as a HANA
Execute Query

Create a View

Publish a dataset to SAP BusinessObjects Explorer
Create a Query & publish it to Explorer

Select Folder & Click on Publish

Log on to Launchpad & check your report in a folder
For in-depth understanding click on
You liked the article?
Like: 0
Vote for difficulty
Current difficulty (Avg): Medium

TekSlate is the best online training provider in delivering world-class IT skills to individuals and corporates from all parts of the globe. We are proven experts in accumulating every need of an IT skills upgrade aspirant and have delivered excellent services. We aim to bring you all the essentials to learn and master new technologies in the market with our articles, blogs, and videos. Build your career success with us, enhancing most in-demand skills in the market.

