Welcome to SAP Lumira Tutorials. The objective of these tutorials is to gain an in-depth understanding of SAP HANA.SAP Lumira is known as a visual intelligence tool that is used to visualize data and create stories to provide graphical details of the data. Data is entered in Lumira as a dataset and you can apply filters, hierarchies, and columns to prepare documents. You can choose various charts like Bar charts, Pie charts, etc. to visualize the data effectively. In addition to SAP Lumira Tutorials, we will cover common interview questions and issues of SAP HANA.
SAP Lumira (formerly called SAP Visual Intelligence) is a self-service, data visualization application for business users.
SAP Lumira grew out of SAP Business Explorer, the company's previous, but more basic, self-service data visualization tool. According to SAP, the two are meant to go hand-in-hand. For example, analysts using SAP Lumira can alter data structures and correlations in whatever way they want, without the help of their IT department, then push the data back into the system so it can then be consumed by more casual users in tools like Business Explorer.
SAP Lumira can either be used in conjunction with the SAP HANA in-memory platform or without. SAP announced the general availability of SAP Lumira during the 2012 SAP Sapphire Now conference in Orlando, Florida, although it was known as SAP Visual Intelligence at the time. SAP announced that it had formally renamed the application SAP Lumira, at the following Sapphire conference in 2013.
SAP Lumira, standard edition allows you to connect to and visualize nearly any type of business data, whether it resides in various enterprise databases, the cloud, or spreadsheets. You can combine, enrich, and visualize data for immediate insights. Start making sense of all your data – go beyond static spreadsheets and basic presentations – without the complexity of traditional reporting.
With SAP Lumira, standard edition you can
SAP Lumira is data manipulation and visualization tool. You can connect to various data sources, select and clean data, manipulate and visualize data with a diverse offer of graphical charts and tables. SAP Lumira is installed locally and can operate on data either remotely or on locally stored datasets. The charts that are created can be saved and sent out by email. Your datasets can be published to SAP Hana, SAP Explorer, the SAP Lumira Cloud, and SAP Streamwork activities. The charts that you create in SAP Lumira are saved in documents with the file format.SViD. This is a document that contains the data source connection information, the data definition and data, and the visualizations.
Basically, SAP Lumira enables business users to access, transform, and visualize data of any size in a repeatable and self-service manner. The tool emphasizes a simple user-friendly interface and creates very captivating visualizations that allow users to swiftly analyze data without the need for scripting.
SAP Lumira’s drag-and-drop interface is easy to become familiar with, and with a few clicks data from multiple sources can be gathered, combined, and visualized. After the tool is installed and system access is set up, training is really not needed, but some basics by someone who knows the tool can be helpful.
SAP Lumira’s capabilities include:
Create a document and acquire a dataset from a Microsoft Excel file

Click on New Document


Acquire a dataset from a universe. Create a New Document

Select Universe

Design Query.

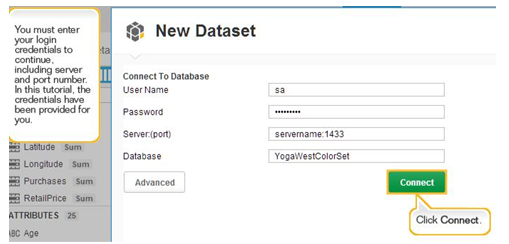
Acquire a dataset from a database using Freehand SQL
Create a new document


Provide details

Select Source table & Write Query


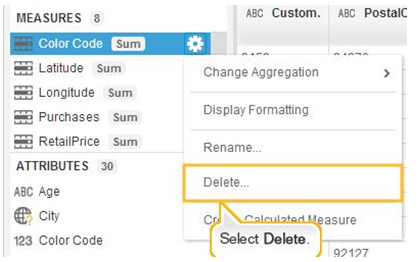
1Manage measures in a dataset-Execute Query

Delete column


Create a measure


Sort, rank, calculate, and filter values in a visualization-Execute any Query

Select any measure & set order


Can calculate


Sharing Results
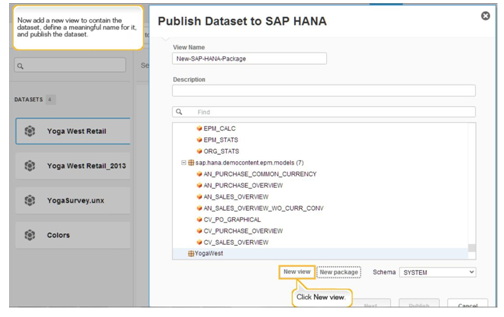
Export a dataset as a HANA-Execute Query

Create a View


Publish a dataset to SAP BusinessObjects Explorer-Create a Query & publish to Explorer

Select Folder & Click on Publish

Log on to launchpad & check your report in a folder
The key features of Lumira are as follows −
Overall, the SAP Lumira Cloud is the best tool available in the present market that lets us analyze data and collaborate with colleagues on datasets, stories, and other business intelligence artifacts from web browsers or mobile devices
You liked the article?
Like: 0
Vote for difficulty
Current difficulty (Avg): Medium

TekSlate is the best online training provider in delivering world-class IT skills to individuals and corporates from all parts of the globe. We are proven experts in accumulating every need of an IT skills upgrade aspirant and have delivered excellent services. We aim to bring you all the essentials to learn and master new technologies in the market with our articles, blogs, and videos. Build your career success with us, enhancing most in-demand skills in the market.