Java is a programming language that developers use to create applications on your computer. Chances are you've downloaded a program that required the Java runtime, and so you probably have it installed it on your system. Java also has a web plug-in that allows you to run these apps in your browser.
The first prototype implementation of the Java Virtual Machine, done at Sun Microsystems, Inc., emulated the Java Virtual Machine instruction set in software hosted by a handheld device that resembled a contemporary Personal Digital Assistant (PDA). Oracle's current implementations emulate the Java Virtual Machine on mobile, desktop and server devices, but the Java Virtual Machine does not assume any particular implementation technology, host hardware, or host operating system. It is not inherently interpreted, but can just as well be implemented by compiling its instruction set to that of a silicon CPU. It may also be implemented in microcode or directly in silicon.
The Java Virtual Machine knows nothing of the Java programming language, only of a particular binary format, the class file format. A class file contains Java Virtual Machine instructions (or bytecodes) and a symbol table, as well as other ancillary information.
For the sake of security, the Java Virtual Machine imposes strong syntactic and structural constraints on the code in a class file. However, any language with functionality that can be expressed in terms of a valid class file can be hosted by the Java Virtual Machine. Attracted by a generally available, machine-independent platform, implementors of other languages can turn to the Java Virtual Machine as a delivery vehicle for their languages.
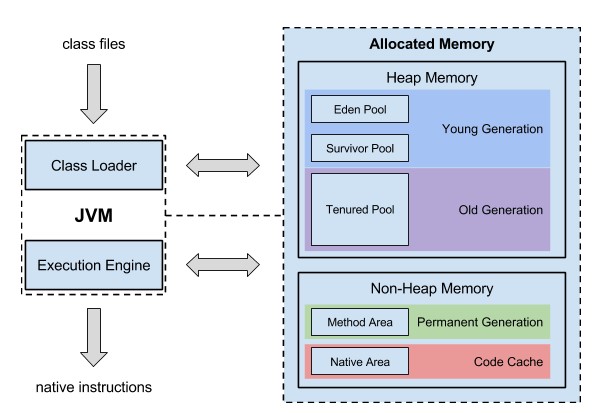
Architecture of Java Virtual Machine
The JVM specification defines the subsystems and their external behavior. The JVM has the following major subsystems:
Class Loader. Responsible for reading Java source code and loading classes into the data areas.
Execution Engine. Responsible for executing instructions from the data areas.The data areas occupy memory that is allocated by the JVM from the underlying OS.
Class Loader
The JVM uses different class loaders organized into the following hierarchy:
- The bootstrap class loader is the parent for other class loaders. It loads the core Java libraries and is the only one written in native code.
- The extension class loader is a child of the bootstrap class loader. It loads the extension libraries.
- The system class loader is a child of the extension class loader. It loads the application class files that are found in the classpath.
- A user-defined class loader is a child of the system class loader or another user-defined class loader.
When a class loader receives a request to load a class, it checks the cache to see if the class has already been loaded, then delegates the request to the parent. If the parent fails to load the class, then the child attempts to load the class itself. A child class loader can check the cache of the parent class loader, but the parent cannot see classes loaded by the child. The design is such because a child class loader should not be allowed to load classes that are already loaded by its parent.
Execution Engine
The execution engine executes commands from the bytecode loaded into the data areas one by one. To make the bytecode commands readable to the machine, the execution engine uses two methods.
- Interpretation. The execution engine changes each command to machine language as it is encountered.
- Just-in-time (JIT) compilation. If a method is used frequently, the execution engine compiles it to native code and stores it in the cache. After that, all commands associated with this method are executed directly without interpretation.
Although JIT compilation takes more time than interpretation, it is done only once for a method that might get called thousands of times. Running such method as native code saves a lot of execution time compared to interpreting each command one by one every time it is encountered. JIT compilation is not a requirement of the JVM specification, and it is not the only technique that is used to improve JVM performance. The specification defines only which bytecode commands relate to which native code; it is up to the implementation to define how the execution engine actually performs this conversion.
Memory Model
The Java memory model is built on the concept of automatic memory management. When an object is no longer referenced by an application, a garbage collector discards it and this frees up memory. This is different from many other programming languages, where you have to manually unload the object from memory. The JVM allocates memory from the underlying OS and separates it into the following areas.
- Heap Space. This is a shared memory area used to hold the objects that a garbage collector scans.
- Method Area. This area was previously known as the permanent generationwhere loaded classes were stored. It has recently been removed from the JVM, and classes are now loaded as metadata to native memory of the underlying OS.
- Native Area. This area holds references and variables of primitive types.
Breaking the heap up into generations ensures efficient memory management because the garbage collector does not need to scan the whole heap. Most objects live for a very short time, and those that survive longer will likely not need to be discarded at all until the application terminates. When a Java application creates an object, it is stored in the
eden pool of the heap. Once it is full, a minor garbage collection is triggered at the eden pool. First, the garbage collector marks dead objects (those that are not referenced by the application any more) and increments the age of live objects (the age is represented by the number of garbage collections that the object has survived). Then the garbage collector discards dead objects and moves live objects to the
survivor pool, leaving the eden pool clear. When a surviving object reaches a certain age, it is moved to the old generation of the heap: the
tenured pool. Eventually, the tenured pool fills up and a major garbage collection is triggered to clean it up. When a garbage collection is performed, all application threads are stopped, causing a pause. Minor garbage collections are frequent, but are optimized to quickly remove dead objects, which are the major part of the young generation. Major garbage collections are much slower because they involve mostly live objects. There are different kinds of garbage collectors, some may be faster in certain situations when performing a major garbage collection. The heap size is dynamic. Memory is allocated to the heap only if it is required. When the heap fills up, the JVM reallocates more memory, until the maximum is reached. Memory reallocation also causes the application to stop briefly.
Threads
The JVM runs in a single process, but it can execute several threads concurrently, each one running its own method. This is an essential part of Java. An application such as an instant messenger client, runs at least two threads; one that waits for user input and one that checks the server for incoming messages. Another example is a server application that executes requests in different threads: sometimes each request can involve several threads running concurrently. All threads share the memory and other resources available to the JVM process. Each JVM process starts a main thread at the entry point (the main() method). Other threads are started from it and present an independent path of execution. Threads can run in parallel on separate processors, or they can share one processor. The thread scheduler controls how threads take turns executing on a single processor.
Performance Optimization
The performance of the JVM depends on how well it is configured to match the functionality of the application. Although memory is automatically managed using garbage collection and memory reallocation processes, you have control over their frequency. In general, the more memory you have available for your application, the less memory management processes are required, which pause your application. If garbage collections are occurring more frequently than you would want, you can start the JVM with more maximum heap size. The longer it takes for a generation of the heap to fill up, the fewer garbage collections occur. To configure the maximum heap size, use the -Xmx option when you start the JVM. By default, the maximum heap size is set to either 1/4th of the physical memory available to the OS, or to 1 GB (whichever is the smallest). If the problem is with memory reallocation, you can set the initial heap size to be the same as the maximum. This means that the JVM will never need to allocate more memory to the heap. However, you will also lose the adaptive memory optimization gained from dynamic heap sizing. The heap will be of fixed size from the moment you start your application. To configure the initial heap size, use the -Xms option when you start the JVM. By default, the initial heap size is set to either 1/64th of the physical memory available to the OS, or to some reasonable minimum that is different for different platforms (whichever is the largest). If you know which garbage collections (minor or major) are causing performance degradation, you can set the ratio between the young and old generations without changing the overall heap size. For applications that create a lot of short-lived objects, increase the size of the young generation (this will leave less memory for the old generation). For applications that operate with a lot of longer surviving objects, increase the size of the old generation (by setting less memory for the young generation). The following ways can be used to control the sizes of the young and old generations.
- Specify the ratio between the young and old generation using the -XX:NewRatio option when you start the JVM. For example, to make the old generation five times larger than the young generation, specify -XX:NewRatio=5. By default, the ratio is set to 2 (the old generation occupies ⅔ of the heap, and the young generation occupies ⅓).
- Specify the initial and maximum size of the young generation using the -Xmn option when you start the JVM. The old generation size will be set to whatever memory remains on the heap.
- Specify the initial and maximum size of the young generation separately, using the -XX:NewSize and -XX:MaxNewSize options when you start the JVM. The old generation size will be set to whatever memory remains on the heap.
Most applications (especially servers) require concurrent execution, handling a number of tasks. Some of these tasks are more important at a given moment, while others are background tasks that can be executed whenever the CPU is not busy doing anything else. Tasks are executed in different threads. For example, a server may have a low-priority thread that calculates statistics based on some data and starts a higher-priority thread to handle incoming data, and another higher-priority thread to serve a request for some of the data that was calculated. There can be many sources of data, and many clients requesting data from the server. Each request will briefly stop the execution of the background calculation thread to serve the request. So you have to monitor the number of threads that are running and make sure there is enough CPU time for the thread that is making the necessary calculations. Each thread has a stack that holds the method calls, return addresses, and so on. Some memory is allocated for the stack, and if there are too many threads, this can lead to an OutOfMemory error. Even if you have enough heap memory allocated for objects, your application may be unable to start a new thread. In this case, consider limiting the maximum size of the stack in threads. To configure the thread stack size, use the -Xss option when you start the JVM. By default, the thread stack size is set to 320 KB or 1024 KB, depending on the platform.
Performance Monitoring
Whether you are developing or running a Java application, it is important to monitor the performance of the JVM. Configuring the JVM is not a one-time affair, especially if you are dealing with a server running on Java. You have to constantly check the allocation and usage of both heap and non-heap memory, the number of threads that the application creates, and the number of classes that are loaded into memory. These are the core parameters. Using the Anturis Console, you can
set up monitoring of the JVM for any hardware component (such as a computer running a Tomcat web server) in your infrastructure by adding the JVM monitor to the component. The JVM monitor can measure the following metrics.
- Total memory usage (MB) is the amount of memory that the JVM uses. This metric can affect overall performance of the underlying OS if the JVM consumes all available memory.
- Heap memory usage (MB) is the amount of memory that the JVM allocates for objects used by the running Java application. Unused objects are regularly removed from the heap by the garbage collector. If this metric grows, it can indicate that your application is not removing references for unused objects, or that you need to configure the garbage collector properly.
- Non-Heap memory usage (MB) is the amount of memory allocated for the method area and the code cache. The method area is used to store references to loaded classes. If these references are not removed properly, the permanent generation pool can increase every time the application is redeployed, leading to a non-heap memory leak. It can also indicate a thread-creation leak.
- Total pool memory usage (MB) is all the memory used by the various memory pools allocated by the JVM (that is, the total memory without the code cache area). This can give you an idea of how much memory your application consumes without the JVM overhead.
- Threads (threads) is the number of active threads in the JVM. For example, each request to a Tomcat server is processed in a separate thread, so this metric can give you an idea of the number of requests that are currently being served, and whether it affects the background tasks that are running in threads set to a lower priority.
- Classes (classes) is the number of loaded classes. If your application dynamically creates a lot of classes, this can be a source of a severe memory leak.
JamVM
JamVM is an open-source Java Virtual Machine that aims to support the latest version of the JVM specification, while at the same time being compact and easy to understand. JamVM must be used in conjunction with a Java class-library to make a full Java Runtime Environment. Compatible class-libraries are GNU Classpath or the class-library from OpenJDK.
Java Virtual Machine Features
For those interested in the design of virtual machines, JamVM includes a number of optimisations to improve speed and reduce foot-print. A list, in no particular order, is given below.
- Execution engine supports many levels of optimisation from basic switched interpreter to inline-threaded interpreter with stack-caching (equivalent performance to a simple JIT).
- Uses native threading (posix threads). Full thread implementation including
Thread.interrupt()
- Object references are direct pointers (i.e. no handles)
- Supports class loaders
- Efficient thin locks for fast locking in uncontended cases (the majority of locking) without using spin-locking
- Two word object header to minimise heap overhead (lock word and class pointer)
- Stop-the-world garbage collector, with separate mark/sweep and mark/compact phases to minimise heap fragmentation
- Thread suspension uses signals to reduce suspend latency and improve performance (no suspension checks during normal execution)
- Full object finalisation support within the garbage collector (with finaliser thread)
- Full support for Soft/Weak/Phantom References (with Reference Handler thread)
- Full support for class and class-loader garbage-collection and unloading (including associated shared libraries)
- Garbage collector can run synchronously or asynchronously within its own thread
- String constants within class files are stored in hash table to minimise class data overhead (string constants shared between all classes)
- Supports JNI and dynamic loading for use with standard libraries
- Uses its own lightweight native interface for internal native methods without overhead of JNI
- VM support for invokedynamic (JSR 292)
- VM support for type annotations (JSR 308)
- VM support for lambda expressions (JSR 335)
- VM support for method parameter reflection
- JamVM is written in C, with a small amount of platform dependent assembler, and is easily portable to other architectures.
For detail info on Java click on


