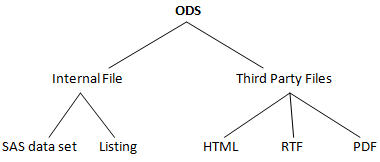
- Using ODS, we can generate reports in required formats. SAS reports we can generate in tables, listings and figures.
- Using ODS concept, we can generate reports in internal files and third party files.
1) HTML Reports:
ods listing close;
ods html file='d:\trt.html';
proc print data = trtment;
run;
ods html close;
ods listing;
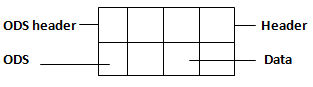
Ods Options:
Obs, obsheader, header, data, total, grand total
Style Option:
It can be used to activate required ODS option.
proc sort data = trtment;
by gid;
run;
Eg: ods listing close;
ods html file='d:\trt.html';
proc print data = trtment;
style(obs) = {foreground = white background = blue}
style(obsheader) = {foreground = white background = red}
style(header) = {foreground = white background = green}
style(data) = {foreground = green background = orange font_weight = bold}}
style(total) = {foreground = blue background = green}
style(grand total) = {foreground = orange background = blue}
sum sub;
by gid;
pageby gid;
title 'This data blongs to #byval(gid);
run;
ods html close;
ods listing;
#(9ash)byval function:
It can be used to supply the values for titles. This function requires only one argument (variable). This argument must be grouping variable.
Byline Option:
It is default global option. It generates bylines in report whenever the report based on by variable or grouping variable.
Var Statement:
It can be used to generate required variables in required colors.
Format Colors:
It can be used to report required data values in required colors.
At TekSlate, we offer resources to help you learn various IT courses. We avail both written material and demo video
tutorials. For in-depth knowledge and practical experience explore SAS Training.
/* To report required variables and required data values in required colors */
Eg: proc format;
value & fcol 'col5mg'='red'
value & fcol 'col6mg'='green'
value & fcol 'col7mg'='black';
value & bcol 'col5mg'='black'
value & bcol 'col6mg'='yellow'
value & bcol 'col7mg'='white';
run;
ods listing close;
ods html file='d:\trt.html';
proc print data = trtment;
style(obs) = {foreground = white background = blue}
style(obsheader) = {foreground = white background = sankar}
style(data) = {font_weight = bold};
var Gid/style = {foreground = gold background = silver};
var drug/style = {foreground = $fcol background = $bcol};
var sub/style = {foreground = pink background = green};
run;
ods html close;
ods listing;
Nowi9ndow Option: It can be used to generate report output window.
2 ODS options for report procedure:
Header: For variables
Column: For data
ods listing close;
ods html file='d:\report.html';
proc print data = trtment headline nowd
style(header) = {foreground = red background = green}
style(column) = {foreground = white background = blue font_weight = bold};
column Gid drug sub;
define gid/group;
define drug/group;
define sub/um;
break after gid/ol ul summarize;
rbreak after /dol dul summarize;
compute after gid;
gid = 'Total';
end comp;
run;
ods html close;
ods listing;
/* To report required colors for required variables and data values */
proc format;
value & fcl = 'white'
others = 'brown';
value & bcl = 'black'
others = 'grey';
run;
ods listing close;
ods html file='d:\report.html';
proc print data = trtment headline nowd
style(column) = {font_weight = bold};
column Gid drug sub;
define gid/group style = {foreground=red background=green};
define drug/group style = {foreground=green background=pink};
define sub/sum style = {foreground=&fcl background=&bcl};
break after gid/ol ul summarize style={foreground=white background= blue};
rbreak after /dol dul summarize style={foreground=green background= yellow};
compute after gid;
gid = 'Total';
end comp;
compute after;
gid = 'Gtotal';
end comp;
run;
ods html close;
ods listing;
(Assignment) /* To report required colors for required variables and data values */
proc import datafile = 'd:\comp.xls'
out = comp1 dbms = excel replace
run;
proc format;
value &fcol 'invest' = 'red'
value &fcol 'est_profit' = 'yellow'
value &fcol 'act_profit' = 'pink';
value &bcol 'invest' = 'blue'
value &bcol 'est_profit' = 'green'
value &bcol 'act_profit' = 'black';
run;
ods listing close;
ods html file = 'd:\report.html';
style(column)={foreground=&fcol background=&bcol};
columns company area (year, _numeric_)
('analysis est_pro_tot act_pro_tot) comments;
define company/group style={foreground=green background=pink};
define area/group style={foreground=orange background=green};
define year/across style={foreground=red background=yellow};
break after company/ol ul summarize style={foreground=orange background=grey};
rbreak after /dol dul summarize style={foreground=green background=pink};
end comp;
compute est_pro_tot;
est_pro_tot=sum(_C4_ , _C7_);
end comp;
compute act_pro_tot;
act_pro_tot=sum(_C5_ , _C8_);
end comp;
compute comments/character length=25;
if _C9_ < _C10_ then comments='analysis is bad';
else comments='analysis is well';
end comp;
compute after company;
company='total&';
end comp;
compute before_page_;
line ' ';
line ' ';
line 'ANALYSIS BELONGS TO SOFTWARE COMPANIES';
line ' ';
end comp;
compute after _page_;
line ' ';
line ' ';
line 'THE INVEST OF ALL COMPANIES';
line ' ';
end comp;
run;
Using this module concept we can generate charts and plots.
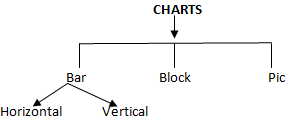
Bar Charts: 2 types
Proc Chart Statement:
Using this statement, we can generate charts. This procedure working based on frequently analysis.
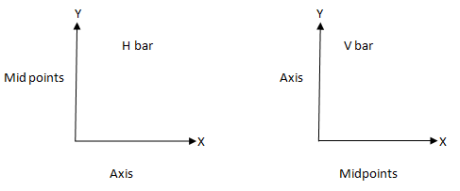
h bar:
Using this, we can generate horizontal bar charts with frequency analysis.
proc freq data=trtment;
table gid;
run;
proc chart data=trtment; {(or) proc chart data=trtment;
hbar gid/nostats; hbar gid/nostats;
run; vbar gid;
proc chart data=trtment; }run;
vbar gid;
run;
It removes statistical analysis from the report.
Using this statement, we can generate vertical charts.
Note: We can write multiple hbar & statements and vbar statement in one chart procedure block.
type Option: Using this option, we can indicate required analysis for reporting.
values for type option frequency , cumulative frequency, sum, percent, cumulative percent.
Sum: Using this option, we can indicate analysis variable for sums.
Axis: Using this, we can give scale in graph if it is horizontal graph we get the scale in x-axis if it is vertical graph we will get in y-axis.
/* Total no of patients received drug doses in each group include all visit */
options ls=240;
proc chart data=trtment;
hbar gid/nostats type=sum sumvar=sub
axis=100 to 350 by 5;
run;
Using this option, we can indicate subgroup variable for analysis.
In chart graph, SAS indicate to subgroup analysis with graph with symbols (letters).
/* Total no of patients received each drug in each group */
Eg: proc chart data=trtment;
hbar gid/nostats type=sum sumvar=sub subgroup=drug;
run;
It can be used to give the scale in required axis based on hbar and vbar statements.
/* Total no of patients received each drug in each visit */
proc chart data=trtment;
hbar week/nostats type=sum
sumvar=sub subgroup=drug
midpoints=0 to 12 by 1;
run;
Block Statement: It can used to generate block charts
Eg: proc chart data=treatment;
block drug;
run;
/* Total no of patients taken each drug */
Eg: proc chart data=treatment;
block drug/type=sum
sumvar=sub;
run;
/* Total no of patients taken each drug in each group */
Eg: proc chart data=treatment;
block Gid/type=sum
sumvar=sub group=drug;
run;
/* Total no of patients received each drug in each group in each visit */
Eg: proc chart data=treatment;
hbar Gid/type=sum
sumvar=sub group=drug;
subgroup=week . nostats;
run;
(or)
Eg: proc chart data=treatment;
block Gid/type=sum
sumvar=sub group=drug;
subgroup=week;
run;
It can be used to generate pie charts. We can't use group and subgroup options in pie statements.
/* Total no of patients received drug doses in each group */
Eg: proc chart data=treatment;
pie Gid/type=sum
sumvar=sub;
run;
/* Total no of patients received each drug in each group */
Eg: proc chart data=treatment;
pie Gid/type=sum
sumvar=sub;
by drug;
run;
- In pie charts, dependent analysis we can be do by using by statement instead of group and subgroup option.
It can be used to generate the charts in graph window(horizontal, vertical, pie -we can generate but block charts we can't run with gchart procedure.)
Eg: proc gchart data=treatment;
pie Gid/type=sum
sumvar=sub;
run;
Eg: proc gchart data=treatment;
pie Gid/type=sum
sumvar=sub;
group=drug subgroup=week;
run;
Plots:
Plot Statement: It can be used to generate plots.
Syntax: Plot yaxis variable * xaxis variable 7 reporting variable;
Eg: proc plot data=treatment;
plot gid * drug;
run;
/* No of patients receivedeach drug in each group */
proc plot data=treatment;
plot gid * drug & sub;
run;
You liked the article?
Like: 0
Vote for difficulty
Current difficulty (Avg): Medium

TekSlate is the best online training provider in delivering world-class IT skills to individuals and corporates from all parts of the globe. We are proven experts in accumulating every need of an IT skills upgrade aspirant and have delivered excellent services. We aim to bring you all the essentials to learn and master new technologies in the market with our articles, blogs, and videos. Build your career success with us, enhancing most in-demand skills in the market.

