Report studio or author advanced reports:
- It is a web-based component used to create professional reports or more advanced reports or complete reports
- Use browser to access report studio
- The following types of reports can be created by using report studio
- List reports
- Cross tab reports
- Chart report s
- Repeater table reports
- Dash boards
- Active reports
- Balance reports to create dashboards
- Map reports ……etc.
- Folders are used to organize the reports
- There are two types of folders in Cognos
- Public folder (default)
- My folder
- A report which is saved in a public folder can be accessed by any folder
- A report which is saved in my folder is specific to that particular user
Components of reports studios GUI:
Inter-table objects pane:
It contains the following there tab
- Source tab (default) : to display package items
- Data items tab : to display query processed items
- Tool Box : to display the predefine objects of report studio GUI
Properties pane:
It is used to set the required properties of the selected item in the work area
It displays the properties of selected item in the work area
Work area:
It is used to create report applications
By default work area contains a report package
Report package contains
- Page wader: use page wader to display the titles, logos
- Page footer: use page footer to display page number date, time
- Page body : use page body to create report
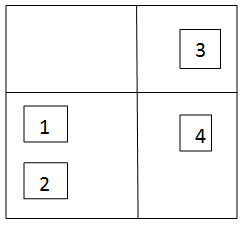
Explorer bar:
It is a vertical bar between insert able objects pane and work area
It contains the following 3 types of explorer
- Page explorer : to explore different pages of a report like a report page, prompt page
- Quarry explorer: it is used to explore the quarries of a report
- Use quarry explorer to use set operations like union, join minus, intersection, etc
- Condition explorer: it is used to perform conditional formatting
Ancestor button:
It is used to display the data in the form of rows and columns (tabular format)
List report contains:
- List header: display column titles
- List body : display actual data items
EX: create list report with order year, order month, quantity and revenue
- Open the browser IE type the following URL http:// localhost/ibm cognos
- From welcome page select author advanced reports (report studios)
- Select the package go sets and relevance
- Select the create name
 select list click on ok
- Expand orders query subject drag order year and quantity and revenue and drop on list report in the work
Saving a report:
- From file menu click on save
- Click on create name folder
- Enter the required name ok double click on the folder
- Enter the name under the folder click on save
- Report created
Executing a report by using report studio:
From menu bar, select run menu click on run report time
Aligning the report:
- Use horizontal alignment and vertical alignment properties to align a report
- Select page body
- From properties pane select horizontal alignment enter
- From vertical alignmentmiddle
Eliminating duplicate values:
- Use group option to eliminate duplicates
Note:
Duplicates are because of one too many relationships between the items in the report
- If there is n items which are having one too many relationships then ‘n-1’ items from top will display duplicates
Procedure to eliminate duplicates:
- Select the order year data item in the list report
- From structure menu, select group/ungroup
Note:
Displaying all records in the single pageoin
- Select run menu select run option
- Set rows per page ‘0’ click on oksognos
Setting colors and fonts:
- Select order year column title cell in the list report
- From properties window select ancestor
 button
- Select list columns titles style
- From properties pane, select font property click on browse
- Select required font size, style, family, weight
- Select for ground color select required color ok
- Click on apply click on ok
Calculating group totals:
Use aggregate functions to perform group calculations
- Select quantity and revenue in the list report
- From data menu summaries “total”
Creating sections:
- Select order year dsa item in the list report
- From structure, menu select ‘section’
Setting page break:
- Select order year section in the report
- From structure menu select ‘set page break’
Merging data cells
- Cognos allows the user to combine multiple data cells into a single data cell
- Use ‘ block object’ to merge data cells
Eg:
Create a list report with order year, order method, quantity, and revenue
- From tool bar click on ‘unlock’

- From insert able object pane select tool box
- Drag block object drop on order year data item in the
- Select order method data item, drag and drop the block
- Select order method data cells from tool bar click on delete
- Select order year column title from tool bar click on delete
- Select order year column title from tool bar delete
- From tool box, drag a text item, drop on the title column call
- Enter column name as order_info ok
Data format:
- Congnos allows t format dates, numbers, currency, time, text_etc
- Use data format property to format the data
EX:
Create list report with order date, order method, qnty, and grass profit
- Select order date data item in the list report
- From properties pane, select data format property
- Click on browse format type date
- Set the following properties
- Data style - full
- Data ordering D.M.Y ok
Report filters:
- A filter which is created at the time of generating the report is called report filter
- A report filter is specific to that particular report
- Report filters are two types
- Detail filters
- Summary filters
Detail filters:
- Detail filter can be created for attributes as well as measures
- In case of measures like qty and revenue, detail filters are categorized into 2 type
- Before auto aggregation
- After auto aggregation
“A filter which is applied for each and every detail record that is called a detail filter “
- Detail filters are two types
Static filter:
A filter which is called with a static value that can’t be changed at run time it is called a static filter
Syntax:
Quarry item operator operand
Ex: 1 – year = 2009
EX: 2 – country in (‘India’, ‘USA’, ‘UR’)
EX: 3- year not in (2005, 2006)
Static filter for attributes:
Create a list report with list report quty, and revenue group on order year total in qty and revenue
- From data menu, select filters- edit filters
- Click on add
 advanced ok
- From order quantity subject drag order year drop on expression definition window
- Type= from tool bar select single value, select the required year click on insert (=2006)
- Click on validate symbol click on ok
- Click on add filter advanced - ok
- Define the following condition
Detail filter for measure:
- Before auto aggregation :
It is a filter condition it is apply before aggregating the detail records than it is called a filter before auto aggregation
Report:
Order year. Order month qty
| Year |
Month |
Day |
Qty |
| 2004 |
1 |
1 |
12 |
|
1 |
2 |
15 |
|
1 |
3 |
09 |
Data base level:
Filter: qty > 10 (before auto aggregation)
Eg:
Create a list report with product type, predict line, qty
- Group on product line total on qty
- From data menu select filters edit filters click on add
- Select advanced ok
- Define the following condition
- Qty 75 (drag qty from order quarry subject)
- Click on ok before auto aggregation ok
Filter after auto aggregation:
If a filter condition is applied after aggregating the detail records, then it is called a filter auto aggregation
Eg: create a list report product type, qty, group of product line, total of qty
- From data menu select filters edit filters
- Click on add select advanced ok
- Define the following condition
- Qty > 100000 ( drag the qty from orders)
- Click on ok select after auto aggregation
- Run the report
Summery filter:
- If a filter condition is applied for group summaries then it is called summery filter
- Use summery filters to filter the data based on group summaries
Note:
To create summery filter first create groups
Eg: create a list report product line, product type, Qty group on product line, qty
- From data menu select filters edit filters summery filters add advanced ok
- Available components drag qty drop on expression definition window
- Type qty>300000 ok
- From scope click on browse product line ok ok
Parameterized filters or dynamic filters: or prompt:
If a filter condition is created with a parameter, then it is called a parameterized filter
- Parameterized filter allows the user either to select the values (S) or to enter the value (S) at run time
- In case of parameterized filter, cognos server creates a prompt page at the time of execution to select the value or to enter the value
Syntax to create parameterized filter:
Query item operator? Parameter?
Eg: year =? Param_year? (name, param_year is parameter name which is user defined )
Create a list report order year, order name, qty, and revenue. Group on order year, total on qty and revenue
- From data menu select filters edit filters add
- Click on advanced ok
- Define following condition
- Order year =? Param_order year?
- Drag order year from orders query subject. Drop on expression definition window --> ok--> optional ok
- Run the report
- Single value means ‘=’ operator
- Multiple values means ‘in’ operator
Eg:
Create a list report with country, product line, order method, qty, and gross profit
- Group on country, product line total on qty and gross profit
- From data menu filter edit filters add advanced
- Click on ok
- Define following condition
- Country =? Param_country?
- Click on ok ok
Note:
Cognos creates a value prompt if the parameterized
- If creates a text box prompt for numeric items
- It creates in_range prompt for data items
Build prompt page:
It is used to create a prompt page with the selected items in the report
- By default it creates parameterized filters for the selected items in the report
Eg: Create a list report with country, product line, selected items in the report
- By defaults it creates parameterized filters for the selected items in the report
Eg: Create a list report with country, product line, order method, qty and revenue
Group on country, product line, total on Qty and revenue
- Select country product line, data items in the list report
- From tools menu select “build prompt page”
- Apply filters
Cascading prompts:
A prompt which takes the values from author prompt is called a cascading prompt
There are two types of cascading [prompts
- Single select, auto submit cascading prompt
- Multi selection
Note: Auto submit works any for single server in case of multi selection, create ’re prompt button’
Ex:
Create a list report with product line, product type, product name, qty, revenue.
- Group on product line, product type, and total on qty and revenue
- Select product, product type, product name by using edit button
- Select product line prompt from properties set multi select no
- Auto submit yes, cascading source name
- Select product type prompt set the following properties
- Multi select no, auto submit yes cascade source click on browse product line ok
- Select product name prompt multi select yes
- Auto submit no, cascade type product type ok
Multi selection:
Select product line prompt set the following properties multi select
yes, auto submit
yes, cascade source re prompt line
- Select product type multi select yes
- Auto submit no cascade source- product type
- Select product name multi select yes
- Auto submit no cascade source product type
Creating a re prompt button:
- From test box drag prompt button drag beside product line prompt page
- Select next from properties select type re prompt
- Similarly create a re prompt button for product types prompt
Creating customized prompt page with a value prompt:
Value prompt:
It allows the user to select the values at the run time
- In case of value prompt, cognos creates a prompt query which will fetch all the district values from database and displays in the value prompt
- Value prompt is very user friendly
- Value prompt allows the user to create radio buttons, drop down list, check box group, to add user option etc
Create a value prompt for order year by creating the prompt page manually
- Create a list report with order year, order method, qty and gross profit
- Group on order year total on qty and revenue
- Select page explorer bar--> select prompt pages
- From insert able objects pane drag a page drop on prompt page window
- Double click on prompt page top open
- From tool box drag a value prompt drop on prompt page
- Create a new parameter enter the name new “param_year”
- Click on next from package item order year ok
- Operator = next
- From tool box drag a text item drop just before value prompt in the prompt page
- Enter the text as order year ok
Creating radio buttons or check boxes group in a value prompt:
- Select value prompt from properties pane select “select ui” property radio button group
Displaying images: (logo)
- Use image object to download the images to run time
- From tool box drag image object drop on the title area
- Select image object from properties select name ”company name”
- From properties, select the “url” property server URL (image URL path)ok
Re creating an already existing download image:
- Use layout component reference object to refer an existing object
- Open report page from tool box, drag layout component reference object, drop in the title area
- Select image ok
Value prompt with user options:
User “static” choice property to add user options to a value prompt
Eg: create a list report with order year, order method and qty, group on order total on qty
- Add a prompt page to the report
- Open the prompt page from tool box drag a value prompt
- Create a parameter (param_year) and click on next
- Package item (order_year)
- Operator (=) click on next and finish
- Drag the text item from toll box and next select order year

- Create radio button to the data body, select “UI” property and select radio ”button group”
- Select value prompt from properties select “static choices” and click on browse then click on add
- Use all, display all, ok
- From page explorer select report page
- From data menu select filters and edit filters
- Double click on the filters
- Define the following expression in the expression definition window
If (? Param_year? /=’all’) than ([do sales_goretailers],[orders],[order year]
Else
[go sales_go retails].[orders].[order_year] = ?param_year?]
- Click on ok
- Run the report
Text box prompt:
It allows the user to enter the value at run time
- In case of text box cognos does not create a prompt query
Eg: Create a list report order year, order method, qty, revenue group on order year total on qty and revenue
Add a prompt page:
- Open a prompt page from tool box drag a text box prompt drag on prompt page
- Create a name parameter (param_year) select order_year.
- Operator = finish
- From tool box drag a text item, drop before text box prompt
- Enter the order year ok
Eg: Create a prompt page with 2 prompts (1 for order year, and one for country) and display the prompts 1 bellow another with messages
- Create text box prompt for order year and value prompt for country
Procedure:
- Create a list report with order year, country, qty, revenue group on order year total on qty and revenue
Add a prompt page to the report:
- Open the prompt page
- From tool box drag a table object, drop on prompt page
- Drag a text item drop in (1,1) cells
- Enter order year : click on ok
- From tool box, drag text box prompt drop on (1,2) cell
- Enter the parameter name (param_year)
- Package item order year
- Operator in click on finish
- Drag a text item drop on (2,1) cell enter the text as select the country ok
- From tool box drag a value prompt drop in (2,2) cell
- Enter the parameter (param_country) next
- Package item country
- Operatorin
- Parameter param_country next finish
Add check box group in the value prompt:
- Select the value prompà properties select UI check group ok
- Display the value in red color
- Use font properly to select color
Select and search prompt:
It allows the order to search for the required values to select the values at run time
Eg:
Create a list report with country, product line, order method, qty, and gross profit
- Create a page and open the prompt page
- Enter the parameter param_country next
- Package item country
- Operator in next finish
- Drag a text item just before prompt page and enter the name “enter the word to search for”
- Run the report
Inline prompt:
A prompt which is created in the report page itself is called inline prompt
Eg: Create a list report with order year, order method, qty, and gross profit group on order year total on quantity and gross profit
- From tool box drag a value prompt drop bellow prompt in the report page
- Enter parameter param_year
- Package item year
- Drag text item enter the value sheet order year
- Select UI check box group for promp
Cascading prompts:
Create a report cascading prompts build prompt page option (use customized prompt page)
Ex: Create a list report with product line, product type, qty, revenue, product name
Group on product time, product type, total on qty on qty and revenue
- Add a prompt page to the report and open the prompt page
- From tool box drag a table object drop on prompt page
- Enter number of columns 2 number of rows 3
- Select show borders ok
- Drag a text item drop in (1,1) cell
- Enter the text name select the product line ok
- Drag a value prompt, drop in (1,2) cell
- Parameter name pram_product line next
- Package item product line
- Operator = next finish
- Drag a text item drop in (2,1) cell
- “ select product type “ (text name) ok
- Drag a value prompt drop in (2,2) cell
- Enter the parameter param_product type next
- Package item product type
- Operator = next - next
- Cascade source param_product line finish
- Drag a text item, drop in (3,1) cell
- Enter “select product name” ok
- Drag a value prompt, drop in (3,2) cell
- Enter the parameter param_product name next
- Package item product name
- Operator in next next
- Cascade source param_product type finish
- Select product line prompt from propertyauto submityes
- Select product type prompt from property auto submit yes
Conditional formatting
It is a process of formatting the report based on given condition or expression
- Conditional formatting provides the user quick way of analysis
- Use condition explorer to perform conditional formatting
- Condition explorer contains the predefined variables which are used to perform conditional formatting
- There are three types of variables in cognos
- String variable
- Boolean variable
- Report language variable
Variable:
It is a temporary memory location used to hold the nature values of an expression temporarily during execution
String variable:
Desired to gain proficiency on Cognos? Explore the blog post on Cognos training online to become a pro in Cognos.
Conditional formatting – string variable:
Use string variable to hold the return values(s) of an expression which is defined with user defined values temporarily at the time of execution
Ex:
If (order year = 2004) then (1)
Else
If (order year = 2005) then (2)
Else
If (order year =2006) then (3)
String variable holds the value wither 1 or 2 or 3 at here, (1, 2, 3) are user defined values
Here (1, 2, 3) are user defined values.
Ex: Create a list report with order_year, order_method, qty group on order year, total on qty.
- Select condition explorer from explorer bar.
- Select variables from insert able object pane drag string variable, drop on variables window.
- Define the following expression in expression definition wind
- If ([query]. [Order year]=2004) then (1)
- else
- If ([query]. [Order year]=2005) then (2)
- else
- If ([query]. [Order year]=2006) then (3)
- From variables select string1 properties name string_year
- From values window click on add

- Values = 1 ok
- Similarly add the values 2 and 3
- Select page explorer select report page1
- Select order year in the list report.
- From ansister select list columns body style.
- From properties pane select style variable click on browsefrom drop down list select string_year.
- Select condition explorer, select the value1 from string_year.
- Set the required color and font by using font properties.
- Select condition explorer, select the value2 from string_year.
- Set the required color and font by using font property.
- Select condition explorer, select the value3 from string_year.
- Set the required color and font by using font property.
- Double click on explorer bar to turn off.
- Run the report.
Conditional formatting – Boolean variables:
Boolean variable is used to hold the return values of a Boolean expression temporarily at the time of execution.
- It can hold the values either ‘yes’ or ‘no’.
Ex for Boolean expression:
Ex: Create a list report to display the records which are having more than 1 lakh in green color and display the records which are having Qty below 1 lakh in red color.
Procedure:
- Create a list report with order year, order method, qty group on order year total on qty.
- Select condition explorer, select variables.
- Drag Boolean variable drop on variable window.
- Define the following expression.
- [Query1]. [Query] > 100000
- Click on validate click on ok
- Open report page from page explorer
- Select page1
- Select qty data item in the list report.
- From properties pane, select style variable
- Click on browse from dropdown list Boolean 1 ok
- Select condition explorer, select the value ‘Yes’
- Set the required green color by using font property.
- From condition explorer, select the value ‘No’
- Set red color by using font property.
- Double click on explorer bar to turn off
- Run the report.
Conditional formatting – Report language variable:
Use report language variable to hold the language names temporarily during execution.
- Display the report in red color when report is executed in Chinese language. Display the report in green color when report is executed in Dutch language. Display the report in maroon color when report is executed in English language (default)
- Create a list report with country, product line, order method, qty and revenue
- Group on country and product line total on qty and revenue.
- Select condition explorer --select variables.
- Drag report language variable drop on variables window.
- Select the languages Chinese and Dutch and English.
- Open report page from page explorer.
- Select any item in the list.
- From assister select list.
- From properties select style variable.
- Click on browse from variables report languages.
- From condition explorer select the value ‘Chinese’.
- Set the required color and font by using font property.
- Similarly set the color and font for the remaining languages.
- Double click on explorer bar to turn off.
Executing a report the required language:
- From run menu run options
- Language Chinese ok
- Run the report.
Drill through:
It is a process of navigating from one report to another report (or) navigating from one place to another place in the report by creating ‘hyperlinks’.
- Use drill through property to create hyperlinks.
- Which allows to perform drill through
Navigating from report to another report (or) Navigating from master to detail:
Master report(or)summary report
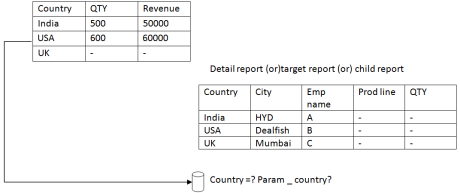
Procedure:
Master report:
Create a list report with country, qty, revenue save the report with the name Couuntry_Master.
Detail report:
- Create a list report with country, city, staff name, product line, qty and revenue. Group on country, city, staff name.
- Total on qty and revenue.
- From data menu select filters edit filters
- Select advanced click on ok
- Add the following condition.
- Country =? Param_country?
- Click on ok
- Save the report with the name country_details.
Creating hyperlinks for country data item in the master report:
- Open country_master report.
- From file menu open country_master open
- Select country data item in the list report.
- From properties pane select drill through definition.
- Click on browse click on add
- From report click on browse Country _Details.
- Click on open
- From parameter click on edit (symbol)
- Enter the following information.
- Name - Param - country
- Type - string
- Required -
 Yes
Yes
- Multi select – none
- Method – data item value
- Value – country
- Property to pass default
- Click on ok ok
- Save the report and execute the report.
Staff – details Report:
- Create a list report with staff name, city, address, work phone, fax and email.
Add a parameterized filter for staff name with the following condition.
Staff name? Param staff name?
- Save the report with the name staff.details
Creating hyperlinks for staff name in country details report:
- Open country – details report.
- Select staff name data item in the country – details list report.
- Right click drill through definition.
- Click on add
- Report staff – details open
- Click on edit (symbol)
- Method – pass data item value.
- Value – staff name
- Click on ok ok
- Save the report and execute the report.
Creating hyperlink for text item:
- Open country – detail report.
- From tool box, drag text item drop in the title area.
- Enter the name as ‘Back’
- Click on ok
- Select text item back right click drill through definition click on add.
- From report country – master open ok
- Save the report.
Book Marks:
It is used to navigate from one place to another place within the report.
- Create a list report with country qty and revenue.
- From toolbox, drag a list object drop below first in the report page.
- Drag country, city, product line, order method, qty and revenue drop on second list (below)
- Group on country, city, product line total on qty and revenue in the second list.
- Select country item in the second list from “structure” menu click on “section”.
Note: Unlock the report to place a book marks in the report page.
- From tool bar click on unlock.
- From tool box, drag a book mark drop beside country section in the report page.
- Select book mark from properties source type data item value.
- Data item value country
- Select country data item in the first list.
- Right click, select drill through definition.
- Click on add
- Select book mark
- Source type data item value.
- Data item country ok
- From tool box drag a book mark drop in the title area.
- From tool box drag a text item, drop beside country book mark.
- Enter the text as ‘Top’ ok create hyperlink
- Select title book mark (Top) from properties source type ‘Text’
- Label Top ok “Create hyperlink” for top text item.
- Save the report with the name book mark – report.
Executing the report in the background by using IBM Cognos connection:
- From welcome page select “My home”
- Browse to location of the report.
- Select gosales and retails batch 8am – reports book mark report.
- From condition select run with options
 for book mark report.
- Format HTML
- From delivery select save the report.
- Click on run ok
- Select refresh button to refresh IBM Cognos connection page to view the output.
- From action select “View the output versions”
- Select the HTML
Master detail relationship:
It is used to create a relationship between master data and detail data based on common item.
- There should be a common item between master layout and detail layout to create master detail relationship.
- Master detail relationship is used to filter the detail data based on master.
Note: Select any item in the detail layout to enable master detail relationship option.
EX: Create a list report with order year, qty and revenue from tool box drag a list object drop beside revenue in the first list report.
- Drag order year, country, product line, qty and revenue drop in the Inner list (detail list)
- Group on order year, country in the inner list.
- Total a qty and revenue.
- Select order year in the inner list.
- From data menu select ‘Master detail relation ships’
- Select ‘New link’ [New link]
- Select order year from query 1 and query 2
- Since order year is common item in this query
- Click on ok run the report.
Report level calculations (or) report calculations:
- Report studio allows the user to device new calculations objects from already existing objects at the time generating the report.
- These calculations are called as report level calculations
- Report calculations are non reusable
- There are 2 types of report calculations
- Query calculations
- Layout calculations
Query calculations:
If a calculation is derived by defining an expression at query level is called a query calculation.
- Query calculation object will be display separate column in the report.
- Use already existing item data source to device query calculation objects.
- Use query calculation object from tool box to perform query calculations.
Ex: Derive a new query calculation with the name plane – revenue by multiplying qty and unit sale price.
- Create a list report with order year, order method, qty and unit sale price.
- From tool box drag query calculation object drop beside unit sale price in the list report.
Name
plane – revenue
ok
Define the following expression in the expression definition window.
[Go sales_go retailers]. [Orders]. [Quantity] * [go sales_go retails]. [Orders]. [Unit sale price]
Click on valid date
click on ok
Calculating plane – revenue in terms of rupees:
- Drag a query calculation object drop beside plane_revenue in the list report.
- Name plane_rev_in_rs ok
- Select data items symbol.
- Drag plane_revenue drop on expression definition.
- Define following definition.
- [plane_revenue] * 60
Converting dollar $ into Indian rupees  :
:
- Use data format property to format currency.
- Select plane_rev_rs in the list report.
- From properties pane select data formats.
- Click on browse.
- Format type currency
- Set the following properties
- Currency --> RP(INR) – India rupee
- Currency symbol Rs
- Currency symbol position beginning
- No of decimal places 0
Err: Derive a new query calculation object with the name staff_name by concatenating first name and last name.
- Don’t display first name and last name in the report.
- Create a list report with order year, order method, revenue.
- From toolbox drag query calculation object drop in between order method and revenue.
- Name staff – name ok
- Define the following expression.
- First name (double click) ll “ll last name.
- ll means (concat operator)
- Select concat operator from functions tab, operator’s folder.
Ex: Derive new calculation objects with the names qty_in_2004, qty_in_2005 and variance country wise and display the countries (or) highlight the countries which are having the variances less than ‘0’
- Create a list report with only country from tool box drag a query calculation object ------------------
- Name qty_in_2004 ok
- Define following the expression.
- If ([order year] = 2004) then ([Quantity])
else
(0)
- Click on validate click on ok
- Similarly calculate qty_in_2005
- By defining following expression
- If ([order year] = 2005) then ([Quantity])
else
(0)
- Click on validate - click on ok
- Drag query calculation object drop beside qty_in_2005 in the list report.
- Name variance ok
- Define the following expression.
- [Qty_in_2004] – [Qty_in_2005]
- Qty 2004, Qty 2005 drag from data item tab.
Highlighting countries which are having variance Less than ‘0’:
- Select conditional explorer variables.
- Drag Boolean variable drop on variable window.
- Define the following expression.
- [Quantity].[Variance] < 0 ok
- From page explorer select report page.
- Select variance in the list report.
- From ansister list columns body style.
- From property style variable click on browse.
- Variable - Boolean 1 ok
- From conditional explorer select the value ‘Yes’
- Set the red color by using font property.
- Turn off explorer bar by double click explorer bar
- Run the report.
Ex: Display top 5 countries revenue wise
- Create a list report with country, revenue from toolbox drag a query calculation object. Drop beside revenue in the report.
- Enter the name ‘Rank ok
- Select functions tab expand ‘summaries’ functions
- Drag rank function drop on expression definition window.
- Drag the revenue drop on expression window beside rank function.
- Rank (revenue)
- From data menu select filters, edit filters.
- Click on add
- Select advanced ok
- Select data items tab drag the rank drop on expression window.
- [Rank] < 6
- Validate ok
- Select ‘after auto aggregation’ ok
Layout calculations:
It is a process of calculating the layouts like displaying current dates as title, current time as title at run time.
- Use layout calculation object to perform layout calculations.
Ex 1: Display the selected country name as a title at run time.
- Create a list report with country, product line, order method, qty and revenue.
- Click on qty and revenue.
- Add a parameterized filter for country with the following condition.
- Country =? Param-country?
- From toolbox drag layout calculation object, drop in the title area.
- Select parameters tab drag the parameter (param_country) drop on expression definition window.
- Param display value (param_country) ok
Displaying report execution data (current data) as a title:
- From toolbox drag layout calculation object, drop in the title area.
- Select functions tab, expand report functions.
- Drag the function “as of date” drop on expression definition window ok
Displaying both countries, current data one below in title area in runtime:
- From toolbox drag a table object drop in title.
- Enter 2/2 columns (2) rows (2) Drag a text item “country name”
- Drag a text item (2,1) cell “current date”
- Drag a layout calculation drop in (1,2) cell
- Select param_country, drag the expression definition windows.
- Drag a layout calculation drop ou (2,2) cell
- Drag “as of date” function drop on expression definition window.
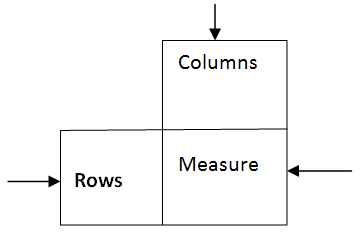
Crosstab Report:
It is a best report for compare to analysis crosstab report displays the data in the form of rows and columns and measures.
Every crosstab report contains
- Row Zone
- Column Zone
- Measure Zone
Note: Intersection of row and column is measure symbolical representation of a cross tab
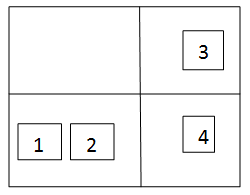
 Types of crosstab:
1. Basic cross tab (or) simple crosstab

2. Nested cross tab
- Nested on rows
- Nested on columns
-
-
Nested on rows
-
Nested on columns
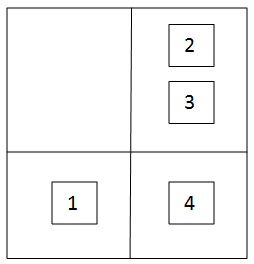
3. Union crosstab (or) Discontinuous crosstab
- Union on rows
- Union on columns
-
Union on rows
b. Union on columns

4. Asymmetric crosstab
Combination of both nested and union
 Ex:
Ex: Create a simple crosstab report writer order flag on rows, Order method on columns and sequence on measures.
- Open report studio with go sets and retailers package
- Then select crosstab ok
- Drag order year, drop on columns
- Drag order method, drop on columns
- Drag columns, drop on measures
- Select the measure zone, select the aggregate function total.
- Run the report.
Note: Displaying the grand total just below columns heading in cross tab.
- Select total in a cross tab drag and drop below revenue (where the big line is blinking)
Nested crosstab:
- Create a crosstab with order year, order month on rows, order method on columns, grass profit on measures.
- From file menu select new select crosstab ok
- Drag order year, drop on rows.
- Drag order month, drop beside order year on rows.
- Drag order method, drop on columns.
- Drag revenue, drop on measures.
- Select measures zone and select aggregate function total
Creating a space between 2 data items in a crosstab:
- From toolbox drag a crosstab space object, drop in between order year, order month items in the crosstab.
- Use different filters, prompt pages (name / yourself)
Union crosstab:
- Create a new crosstab report drag order year, drop on rows.
- Drag order month, drop below order year on rows.
- Drag product line, drop on columns.
- Drag revenue, drop on measures.
- Create a space between order year and order month.
Chart Reports:
- Use chart reports to display the data in the form of graph.
- Chart allows the user to represents the data in a pictorial way or a graphical way.
- The following of types charts.
- Column chart
- Bar chart
- Line chart
- Pie chart
- Gauge chart ….etc
- Column chart and pie chart are most frequently used charts in real time.
- Create a column chart with order year on categories (X-axis), order method on series and requires on measures (Y-axis)
- From file menu select new select chart column , chart ok
- Drag order year drop on categories (X-axis).
- Drag order method drop on measure (Y-axis)
- Run the report.
Hiding the values in a column chart:
- Select column chart from properties select tooltip property hide, yes means(show)
To increase (or) decrease a chart:
- Select chart report from property, select size and overflow click on browse. Height 6 in, width 5 in. ok
Pie chart:
- From file menu select new chart ok
- Select pie donut select the chart ok
- Drag order year, drop on categories (pies)
- Drag order month, drop on series (pies slices)
- Drag revenue, drop on default measure
Displaying the measure value per each and every pie outside with lines:
Select pie chart from properties.select values
outside slices with lines
Displaying the values internal of percentage:
Select pie chart from properties, select value representation
present
Sharing the same information between multiple layouts:
(List, crosstab, chart):
Sharing the information between the layouts improves the performance.
- Create a list report with order year, order method send qty.
- From toolbar drag a crosstab, drop list layout in the report page.
- Select anywhere in the crosstab.
- From properties select query Query
- Select data items tab (Icon)
- Drag order year from query, drop on crosstab rows.
- Drag order method, drop on measures in crosstab.
- From tool box drag a chart drop below crosstab in the report page.
- Select chart from properties select.
- Query query 1
- Select data items tab (Icon)
- Drag order year from query 1 drop on categories.
- Drag order method, drop on series.
- Drag qty drop on default measures in pie chart.
Conditional Blocks:
- Use conditional blocks the required layout based in the condition satisfied.
- Use block variable incase of conditional blocks.
Ex: Create a list report with order year, order method, and qty. group on order year total on qty.
- From tool box drag a crosstab drop below list.
- Drag order year drop on rows.
- Drag product line drop on columns.
- Drag grass profit drop on measure.
- From tool box drag a chart drop below crosstab
- Select column chart click on ok.
- Drag order year drop on categories.
- Drag order month drop on series.
- Drag revenue drop on measures.
Creating a value prompt with user defined values:
(List, crosstab, chart):
- From page explorer select prompt page.
- Drag a page drop on prompt pages.
- Double click on prompt page.
- From tool box drag a value prompt drop on prompt page.
- Enter the parameter param_layout next.
- Click on finish.
- Drag text item drop before value prompt.
- Enter the text as “select the layout” ok
Create radio buttons in the value prompt:
- Select value prompt from properties select UI radio button group.
Adding the user options to a value prompt:
- Select value prompt from properties
- Static choices click on add
- Use list
- Display list. ok
- Click on add
- Use crosstab
- Displaycrosstab ok
- Click on add
- Use chart
- Display chart ok ok
Creating string variable:
- Select condition explorer select variables.
- Drag string variable drop on variables window.
- Define the following expression in expression definition window.
- If (param display value (“param_layout”)=’list’) then (‘A’)
Else
If (param display value (“param_layout”) =’crosstab’) then (‘B’)
Else
If (param display value (“param_layout”) =’chart’) then (‘C’)
- Click on validate ok
- From values window click add
Enter A
ok
- Similarly add B and C ok
- From page explorer select report page
- From tool box drag “conditional blocks” object drop on empty space in the report page.
- Select conditional block in the report page.
- From properties select block variable property
- Click on browse variable string 1 ok
- From properties select “current block” A
- Select order year in the list from assister select list
- Drag the list layout, drop in the conditional block.
- Select conditional block from properties
- Current block B
- Select any item in the crosstab from assister select crosstab.
- Drag the crosstab drop in the conditional block.
- Similarly de for chart layout.
- Save the report.
- Run the report.
For indepth understanding Cognos Training click on

