Data Science is no more a buzzword, it's a growing demand for every company to analyze the available data set to provide the right direction to the business. If you start searching for a job, you will see the increasing demand for Data Scientists on every job portal across the globe. An increase in the usability of AI, machine learning, and deep learning applications in our daily life will create more jobs in the market. The only thing you need to do is to upgrade your skill sets with Mindmajix DataScience Course to match the changing demand unless it's too late.
And also our experts compiled the best Data Science Interview Questions which helps you to clear your interview and acquire your dream job as a Data Scientist.
Categories of Data Science Interview Questions
Ans: Data Science is the mechanism of utilizing algorithms, big data analytics, machine learning, and programming languages such as Python, R to analyze the hidden patterns of data and predict useful results.
Ans: Supervised learning uses trained data sets, i.e., known and labeled data, and uses feedback mechanisms, whereas unsupervised learning uses unlabeled data and does not support feedback mechanism. Decision trees, regression, and support vector machines are examples of supervised learning. K-means clustering, hierarchical clustering, and the Apriori algorithm are examples of unsupervised learning.
Ans: A selection bias is an error that occurred due to the wrong selection of data. Selecting individuals, groups, or data in such a way that they don't actually represent the population intended for the research.
Ans: A Confusion matrix is a two x two table that provides four outcomes. Based on these four results, you can measure the characteristics of data such as error-rate, sensitivity, accuracy, precision, etc.
|
True Positive(TP) |
False Negative (FN) |
|
False Positive (FP) |
True Negative (TN) |
Confusion Matrix
The Confusion matrix predicts the following four values:
True Positive: Correct positive prediction
True Negative: Correct negative prediction
False Positive: Incorrect positive prediction
False Negative: Incorrect negative prediction
Inclined to build a profession as Data Science Developer? Then here is the blog post on, explore "Data Science Training "
Ans: The 'wide' format has all the responses in the same row, whereas the 'long' format captures only one response in a row - for another response, it uses another row.
Wide Format
|
Name |
Height |
Weight |
|
Soham |
5.5" |
67 |
|
Manoj |
5.7" |
75 |
Long Format
|
Name |
Attribute |
Value |
|
Soham |
Height |
5.5" |
|
Soham |
Weight |
67 |
|
Manoj |
Height |
5.7" |
|
Manoj |
Weight |
75 |
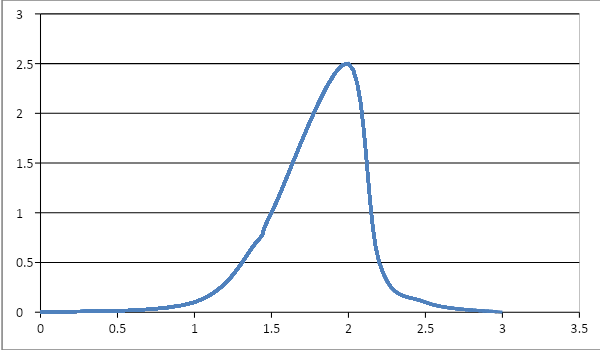
Ans: There are different ways that you can represent a data set, either to the left or to the right or jumbled up. In a normal distribution, the data is distributed around the central peak value. It provides it a bell-shaped curve.
Ans: Correlation and covariance are part of probability and statistics. Correlation provides the relationship between two variables whereas covariance signifies how two random values deviate from their expected values. Correlation provides the quantitative relationship between two values. The positive value shows that the parameters are directly proportional whereas the negative value shows that they are inversely proportional.
Ans: the advertisement, how much to modify, at what places, etc. And upon modification, what was the result, whether the number of clicks increased.
Ans: Pandas is an open-source Python library basically used for data manipulation. It can calculate the mean, median, and mode of the given data set. Many other functions such as modifying rows, columns become pretty easy with Pandas. It operates on Python and Numpy with their lists and dictionaries. It can operate on one-dimensional, two-dimensional, and multi-dimensional data over time.
Ans: Data alignment is the process of how you access the data. For example, you can use column data as row data and vice versa easily with Pandas.
Ans: Matplotlib is a Python library used for data visualization in the form of plots like line plot, bar plot, scatter plot, box plot, etc. The main module is Pyplot under Matplotlib. Matplotlib is the object name and Pyplot is the function name. It can be easily integrated with Python or Pandas.
Ans: Series objects are used with the one-dimensional data whereas Dataframe is used for two-dimensional data.
Ans: Numpy is a linear algebra library in Python. It is used for mathematical and logical operations on arrays. It has extra features compared to the normal lists. It can be used for one dimensional, two-dimensional, multi-dimensional array.
The syntax to import Numpy in Python:
import NumPy as np
Ans: A subplot is used to have multiple graphs in a single plot.

Ans: Following are the plots that you can use in Matplotlib:
Line plot
Bar plot
Scatter plot
Histogram
Box plot
A line plot is used mainly with linear regression models. Bar plot is used to provide the area besides providing the trends of data. Scatter plot, points are not joined. If continuous data is not available, use scatter plot otherwise you can use lie plot. This is used to make different clusters.
The histogram is basically used for image processing, for example, frequency of data points (CPU usage) in CPU processing.
Ans: Box plot contains quartile information. It shows the minimum value, mean value, and maximum value. It shows the distribution of the data and the volume of data scattered all over the plot. The height of the box signifies the number of points.
Ans: The Quiver plot shows the vector direction as arrows.
Ans: The shape of a plot is that of a Violin. It shows the probability density function.
Ans: First calculate the line error, which is the distance between the actual points and predicted points.
Suppose (x1, y1), (x2, y2), and (x3,y3) are three points on the plane. The distance between the regression line and the data points are known as error values.
Calculate the mean value of all the projections of the points, suppose that is mean of y or y︠
SE line = (YA-YP)x12 - (YA- YP)x22 - (YA- YP)2 ……… (YA- YP)xn2 This is the distance from each y value of the point to the regression line.
Calculate the squared error from the mean line, SE Y︠ = (Y1-Y︠)2 - (Y2- Y︠)2 - (Y3- Y︠)2 - (Y4- Y︠)2 ……… (Yn- Y︠)2 This is the central tendency of the line.
To get the good fit of the line = 1 - SE line / SE Y︠ This is also known as R2 value or Least Squared Error Method
Following are the inferences from the R2 method
If the SE line value is less than or equal to 0, R2 is nearly 1. This is a good fit.
If the SE line value is higher but less than the SE line, R2 is approximately 0. This is a bad fit.
Ans: In the real scenario, you have a large number of rows and columns of data that will be difficult to interpret. Hence, using graphics, it's easy to analyze the data, that's called data visualization.
Ans: A bar graph shows the categorical data (price, place, etc ) whereas a histogram shows the numerical data. A bar graph compares the discrete variables but the histogram displays the frequency distribution of the continuous data.
Ans: The Pie chart is used to show the percentage of proportional data when you have more than four categories.
Ans: A Doughnut chart is the same as that of a Pie chart - the difference being that it shows the area instead of the percentage. You create two Pie charts and combine them.
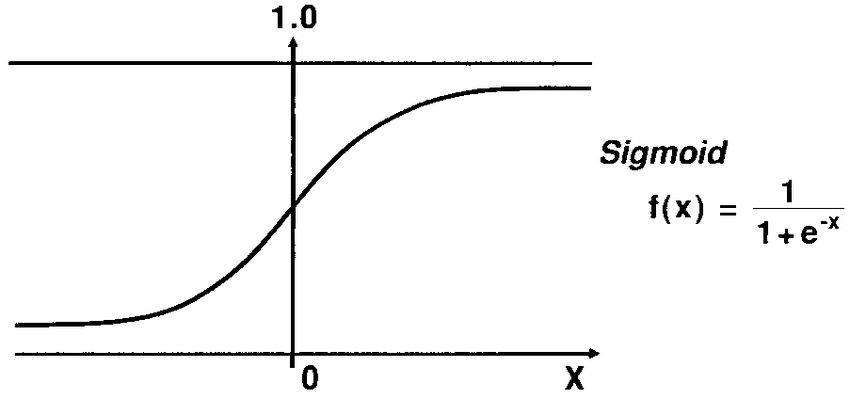
Ans: The S-shaped curve is known as the Sigmoid curve, also known as the Asymptotic curve. It neither reaches 0 nor 1, but stays in between.
It stays between +∞ and -∞
Sigmoid function = 1/1+e-x
Ans: The probability density function shows the probability of an event/point happening in a range.
Ans: P-value signifies the strength or accuracy of the result. If P<0.05, the probability is more than the result can be ignored. When P>0.05, the probability is higher that the result will be considered.
P=0.05 means the hypothesis can go either way.
Ans: Bayes theorem gives the probability of the second event (B) when the first event (A) has already happened or true. For example, based upon an examination, 30% of people who had a positive tests for cancer were diagnosed with cancer later.
P(A/B) = P (B/A) P(A)/P(B)
Ans: Overfitting and underfitting are the errors that occur during selecting a model. When a model is selected in a way that has considered even an unnecessary data set that was not required in taking the accurate decision, it is called overfitting. This also causes the introduction of noise into the model. You can use cross-validation, regularization, pruning, model comparison to avoid the chances of overfitting.
Underfitting is the error when the model has not considered the sufficient data set for the analysis. Such models can provide poor performance results. You can use decision trees, logistic regression, and linear regression to avoid underfitting from cropping into the system.
Ans: K-means algorithm is the clustering algorithm. Here, K is the number of clusters. Mean calculates the mean of the cluster from the individual data points.
For example, sorting sensor measurements, behavioral segmentation, inventory categorization, etc.
Ans: Data cleaning comprises many steps to assure that all the impurities or dirty data are removed. It can also comprise the step to remove the data sets not useful for our analysis though these data sets are logical and meaningful.
Ans: An ROC curve stands for the Receiver Operating Characteristic curve. It is a curve between the true positive rate and the false-positive rate. It helps to find out the right trade-off between the true positive and false-positive rates.
Ans: Python would be preferred because it has Pandas that helps in easy data analytics. Moreover, Python is faster on text analytics compared to R.
Ans: There are several variables used for the analysis. When only one variable is used for the statistics, such as to calculate the sales in a particular area, it is known as univariate.
When two variables are used for analysis, it is known as bivariate. For example, to analyze the sales and the expenses incurred for a particular area.
The multivariate analysis uses more than two variables for analysis.
Ans: From a given set of values, interpolation is the method of estimating a value from two known values. Extrapolation is the method in which a value is estimated by extending the given set of values.
Ans: Dividing the data into unique sets is called clustering. It can be numeric or string such as (0,1) or (cat, dog, monkey…….).
In classification, a generic set of instructions are to be followed to classify the group.
Ans: Probability = Chances that he caught the fish/Total number of chances
2/5
Odds = Chances that he caught the fish/chances that he failed to catch
2/3
Ans: Sampling is the method of identifying a group of data from a large set of data, and then analyzing and forecasting the result.
Sampling can be of the following types:
Simple random sampling
Cluster sampling
Multistage sampling
Systematic sampling
Ans: A validation dataset is used to avoid overfitting. It compares the performance of the training datasets and decides which one to select for the analysis.
A test dataset doesn't depend upon the training dataset. Test dataset assesses the performance of the selected model.
Ans: Cross-validation is used to test the data set using machine-learning methods.
Cross-validation consists of two steps:
The data set is divided arbitrarily into a training dataset and test dataset.
The training dataset validates the parameters taken for the analysis and the test dataset verifies the performance of the model.
Step 1 and step 2 are repeated several times until the desired performance is achieved.
Ans: Machine learning is the study of algorithms and models to do the predictive analysis of data to perform a specific task with the help of patterns and inferences found in data. It uses mathematical models that are built on sample data, known as training data to make predictions. Machine learning is also known as predictive analytics.
Ans: A recommender system predicts how the user will predict the product, whether the user will provide a good rating, etc. It is used in areas such as news, movies, social media, online shopping websites, etc.
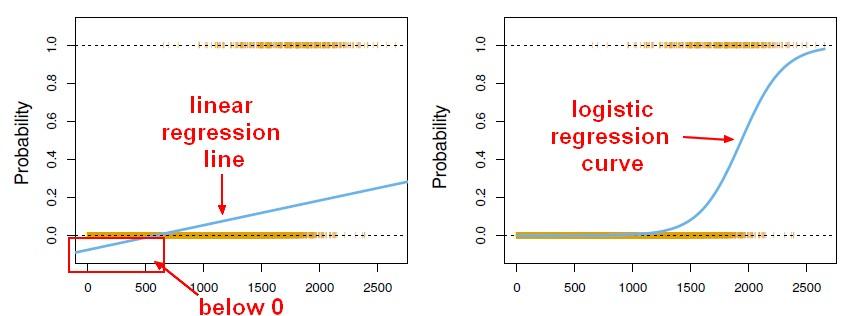
Ans: Linear regression is the method of finding out the relationship between the criterion variable (dependent variable) and one or more predictable variables (independent variables).
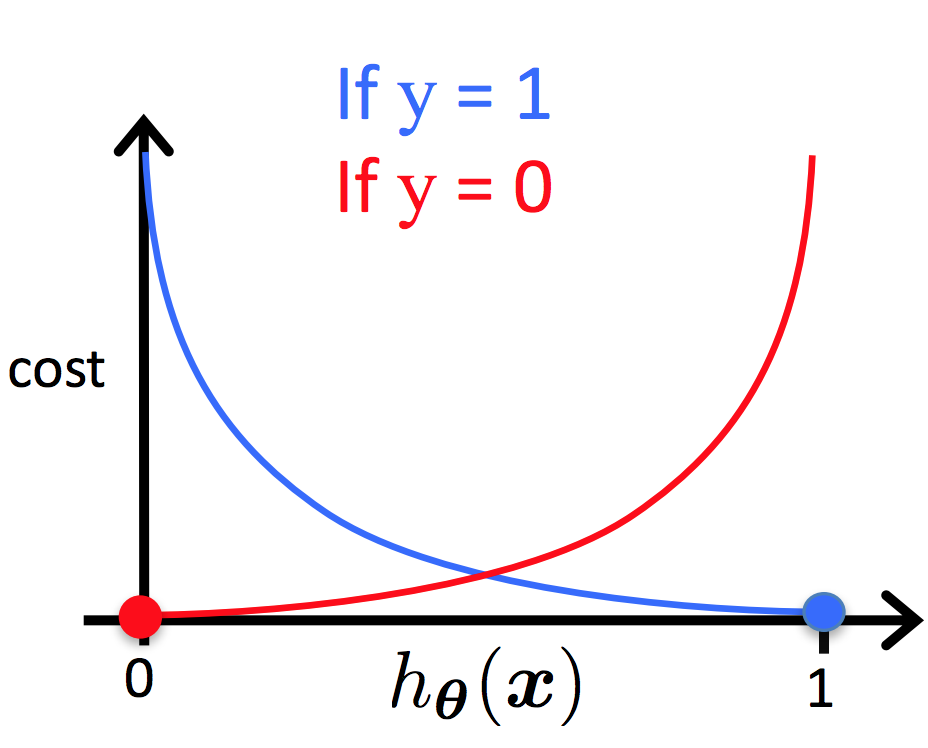
Ans: Logistic regression provides the probability of happening of an event such as pass/fail, yes/no, alive/dead, etc. The value will be either 1 or 0. It is also known as logit regression.
The main difference between linear and logistic regression is that linear regression is continuous in nature and it takes a range of values whereas logistic regression is binary in nature and it takes either True (1) or False (0) value. Linear regression can even take negative values that is not possible with logistic regression.
The Sigmoid function is a very good example of logistic regression.
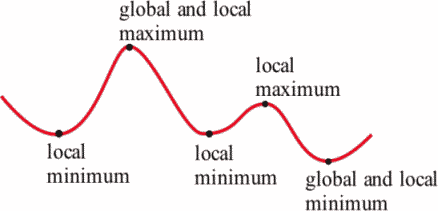
Ans: Using a gradient descent algorithm, you use contour plots to get the minimum value of the curve. For categorical data sets, the curve such as a cost function then yields a zig-zag curve that has many false minimum values. These values are also known as local minimas. So, the function gets stuck at these local minimums, which gives you the false result.
But, with the logistic regression, this is not the case as this uses a straightforward curve and there's no question of local minimums.
Ans: First, find out the variables that have missing values and then try to find out the patterns of the data. If you are unable to find out the patterns, substitute the missing values with the mean or median values. If maximum values are missing, suppose 80%, you can drop that variable altogether.
Ans: Deep learning is the approach of training machines in such a way that it can perform human brain functions such as data processing, decision making, etc. It is useful in every field from social networking to medical image processing to speech recognition.
Following are the deep learning frameworks:
Pytorch
Microsoft Cognitive Toolkit
Caffe
TensorFlow
Keras
Chainer
Ans: Artificial Neural Network is the framework in which a machine can function like a human brain. The machine analyses the built-in examples to process the request and provide the solution. No programming is required for such machines.
Ans: Backpropagation is the method of traversing errors backward using gradient descent. This process calculates the gradient error function with respect to the neural network weights.
Following are the variants of the Backpropagation:
Stochastic Gradient Descent: A single training example is used to calculate the gradient.
Batch Gradient Descent: The complete dataset is used to calculate the gradient.
Mini-batch Gradient Descent: Mini batch is used to calculate the gradient.
Ans: The whole data set is first cleaned and then divided into a training data set and test data set. The ratio could be 80/20, 75/25, or 70/30, etc. But the training data set will be always greater than the test data set although it cannot be 100%
The training data set is used to provide the different patterns to the machine in the form of algorithms to infer the result. Test data set then use instructions/commands to test the model for its correctness and accuracy.
Ans: A random forest is a machine learning approach used to perform regression and classification tasks. It has many decision trees in it. This method can also be used to find out the missing values, outlier values, etc. This approach is also known as the ensemble learning method as it can be used to combine weak models to form a powerful model.
Ans: Machine learning is the learning approach in which computers are made to work like human brains without being explicitly programmed. In deep learning, computers are enabled to make decisions with the pre-fed examples. Reinforcement learning helps computers to make decisions based on reward/penalty analysis.
Ans: Pruning is the process of removing the less powerful nodes from a decision tree. It reduces the size of the decision tree. Dividing the root node into children nodes is called splitting.
Ans: Information gain signifies the gain in the entropy after splitting a dataset. A decision tree aims at finding out the way to increase the information gain.
Ans: A Gini index measures the impurity used in the decision tree.
Ans: False positives are the instances when a non-event is wrongly classified as an event. This is also referred to as a Type I error.
False negatives are the instances when events are wrongly classified as a non-event. This type of error can also be known as a Type II error.
Ans: The decision tree works upon a top-down approach. It starts from the root node and data partitioning is done downwards that makes the sub-nodes or branches of the tree. If the partitioning is homogeneous, it is called that entropy is zero, otherwise, if the partitioning is done equally among nodes, it is called that entropy is one.
Information gain means adding the data whose attribute contributes to the result. This happens when you partition the data into homogeneous sets. Hence, an increase in information gain indicates a decrease in entropy.
Ans: Though both of the methods provide almost the same results in most of the cases, the random forest method is preferred because accuracy is more in the random forest method.
Ans: Dropout is the process of leaving the nodes with hidden values and data to avoid overfitting. Batch normalization is the method of improving the performance and increasing the stability of the neural network. It is ensured that in the normalization process at every layer, the mean output should be zero and the standard deviation should be one.
Ans: TensorFlow consists of both C++ and Python APIs and its compilation time is less than other deep learning libraries such as Keras and Torch. TensorFlow is an open-source library used for numerical computation to ease machine learning and deep learning.
Ans: Tensor means an n-dimensional array of data with ranks fed as an input to the neural network.
Ans: R is massively used in big data analytics and is the most widely used in data science worldwide. For example, Google, Facebook, LinkedIn useR for many of their functions. R is an open-source, highly compatible, and platform-independent language.
Ans: To sort the Dataframe in Python by index. The sort_index () method is used for sorting. By default, it is in ascending order.
Ans: When you do data analytics using Python, you should have a good understanding of basic programming functions, libraries, tuples, data types, lists, etc. Basic knowledge of array operations, Numpy, Panda Dataframe, matrix operations, and the element-wise vector is also desired. Besides, you should also have Scikit learn knowledge, loops, ability to write small functions, sorting, indexing knowledge.
You liked the article?
Like: 0
Vote for difficulty
Current difficulty (Avg): Medium

TekSlate is the best online training provider in delivering world-class IT skills to individuals and corporates from all parts of the globe. We are proven experts in accumulating every need of an IT skills upgrade aspirant and have delivered excellent services. We aim to bring you all the essentials to learn and master new technologies in the market with our articles, blogs, and videos. Build your career success with us, enhancing most in-demand skills in the market.