The Tableau workspace consists of menus, a toolbar, the Data window, cards that contain shelves and legends, and one or more sheets. Sheets can be worksheets or dashboards.
Worksheets contain shelves, which are where you drag data fields to build views. You can change the default layout of the shelves and cards to suit your needs, including resizing, moving, and hiding them.
Dashboards contain views, legends, and quick filters. When you first create a dashboard, the Dashboard is empty and all of the worksheets in the workbook are shown in the Dashboard window.

Data fields appear on the left side of the workspace in the Data window. You can hide and show the Data window by selecting Window > Show Data Window. You can also click the minimize button in the upper right corner of the Data window.

Tableau’s toolbar contains commands such as Connect to data, New Sheet, and Save. In addition, the toolbar contains analysis and navigation tools such as Sort, Group, and Highlight.
At TekSlate, we offer resources to help you learn various IT courses.
We avail both written material and demo video
 tutorials. For in-depth knowledge and practical experience explore Tableau Training.
Toolbar Description
Undo: undoes the last task you completed.
Redo: repeats the last task you canceled with the Undo button.
Save: saves the changes made to the workbook.
Connect to Data: opens the data page where you can create a new connect or select one from your repository.
New Sheet: creates a new blank worksheet.
Duplicate Sheet: creates a new worksheet containing the exact same view as the current sheet.
Clear: clears the current worksheet. Use the drop-down list to clear specific parts of the view such as filters, formatting, and sizing.
Automatic Updates: controls whether Tableau automatically updates the view when changes are made. Use the drop-down list to automatically update the entire sheet or just quick filters.
Run Update: runs a manual query of the data to update the view with changes when automatic updates is turned off. Use the drop-down list to update the entire sheet or just quick filters.
Swap: moves the fields on the Rows shelf to the Columns shelf and vice versa. The Hide Empty Rows and hide Empty Columns settings are always swapped with this button.
Sort Ascending: applies a sort in ascending order of a selected field based on the measures in the view.
Sort Descending: applies a sort in descending order of a selected field based on the measures in the view.
Group Members: creates a group by combining selected values.
Show Mark Labels: toggles between showing and hiding mark labels for the current sheet.
Presentation Mode: toggles between showing and hiding everything but the view.
View Cards: shows and hides the specified cards in a worksheet. Select the cards you want to hide or show from the drop-down list.
Fit Selector: specifies how the view should be sized within the application window. Select either a Normal fit, Fit Width, Fit Height or Entire View.
Fix Axes: toggles between locking the axes to a specific range and showing all of the data in the view.
Highlight: turns on highlighting for the selected sheet. Use the options on the drop-down list to define how values will be highlighted.
Show Me!: displays alternative views of the data, in addition to the best view according to best practices. The options available depend on the selected data fields.
Tooltips
Tooltips are additional data details that display when you rest the pointer over one or more marks in the view. Tooltips also offer convenient tools to quickly filter or remove marks or view underlying data. Tooltips consist of a body, action links, and commands.
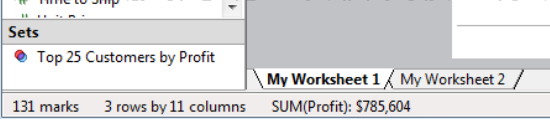
Status Bar
The status bar is located at the bottom of the Tableau workbook. It displays descriptions of menu items as well as information about the current view. For example, the status bar below shows that the view has 131 marks shown in 3 rows and 11 columns. It also shows that the SUM(Profit) for all the marks is $785,604.
Cards and Shelves: Every worksheet contains a variety of different cards that you can show or hide. Cards are containers for shelves, legends, and other controls. For example, the Marks card contains the mark selector, the size slider, the mark transparency control, and the shape, text, color, size, angle, and level of detail shelves.

Cards can be shown and hidden as well as rearranged around the worksheet.
The following list describes each card and its contents.
Each card has a menu that contains common controls that apply to the contents of the card. For example, you can use the card menu to show and hide the card. Access the card menu by clicking on the arrow in the upper right corner of the card.
You liked the article?
Like: 0
Vote for difficulty
Current difficulty (Avg): Medium

TekSlate is the best online training provider in delivering world-class IT skills to individuals and corporates from all parts of the globe. We are proven experts in accumulating every need of an IT skills upgrade aspirant and have delivered excellent services. We aim to bring you all the essentials to learn and master new technologies in the market with our articles, blogs, and videos. Build your career success with us, enhancing most in-demand skills in the market.

