Inspecting Data in Tableau
Once you have created a view, Tableau offers a selection of a that help you isolate the data of interest and then continue to explore and analyze. For example, if you have a dense data view, you can focus on a particular region, select a group of outliers, view the underlying data source rows for each mark, and then view a summary of the selected marks include the average, minimum, and maximum values.
- Select
- Zoom Controls
- Pan
- Undo and Redo
- Drop Lines
- Summary Card
- View Data
- Describing the View
Select
Selecting marks is useful when you want to identify a subset of the data view, visually or you want to run an action.
You can select any individual mark by clicking on it. You can select multiple marks by holding down the Ctrl key. You can also drag the cursor to draw a box around the marks you want to select. Finally, you can combine these methods to select all the marks of interest quickly.
Zoom Controls
Tableau has a set of zoom controls that display in the upper left corner of the view. By default, these controls only display when you hover over a map view. You can control when the zoom controls display by selecting View > Zoom Controls and then select one of the following options:
- Automatic– displays when you hover the mouse over map views.
- Hide– never displays.
- Show on hover – displays when you hover the mouse over all views.
These settings also apply to the view when it is opened in Tableau Reader or Tableau Server. You must specify a setting for each worksheet.
The zoom controls allow you to zoom in and out, zoom to a specific area, and fix or reset the axes. Each control is described below.
| These core tutorials that help you to learn the Inspecting Data in Tableau. For in-depth knowledge and practical experience explore Tableau Training. |
Zoom In and Out
Zooming is useful when you have a lot of data in a view, and you want to focus on a specific part of the view without excluding the rest. Click the plus button to zoom in on the view and the minus button to zoom out. If the zoom controls are hidden, double-click the view to zoom in and hold down SHIFT and double-click to zoom out.
Area Zoom
Rather than zooming in and out on the entire view, you can select a specific area to zoom to. When you zoom in on an area, the view is enlarged so that the selected area fills the window. Select the Area Zoom button and then click and drag in the view to select the area to zoom. If the zoom controls are hidden, hold down CTRL + SHIFT and then drag the mouse to select the area you want to zoom to.
Reset Axes
When you zoom in or out the axes in the view are locked to a specific range. You can quickly reset the view back to the automatic axis range by clicking the Reset Axes button in the zoom controls. This button is also available on the toolbar.
Pan
You can move your view of a table up and down as well as left and right with the pan tool. There are two uses of panning. The first is when you have zoomed in on a view, particularly a map, and want to move the map around to see other marks of interest. The second is when your data view contains many panes, and you want to move quickly from pane to pane.
Use the Pan tool by holding SHIFT and then dragging the cursor across the view.
Undo and Redo
You can perform unlimited undo and redo of your actions. You can undo almost all actions in Tableau by pressing the Undo button on the toolbar. Likewise, you can redo almost all actions by pressing the Red button on the toolbar.
In this regard, every workbook behaves like a web browser. You can quickly return to a previous view. Or you can browse all the views of a data source that you have created. Tableau saves the undo/redo history across all worksheets until you exit. The history is not saved between sessions.
Drop Lines
Drop lines are most useful for distinguishing marks and calling out their position in the view. For example, in a view that is dense with scatter marks, you can turn on drop lines to show the position of a particular data point. When you add drop lines, a line is extended from the marks to one of the axes. You can choose to show drop lines all the time or only when a mark is selected.

To add drop lines to the view:
- Right-click on the pane and select Drop Lines.
By default, drop lines are set only to show when the mark is selected. You can change this setting and specify other options in the Drop Lines dialog box.
To edit drop lines:
Right-click on the pane and select Edit Drop Lines to open the Drop Lines dialog box.
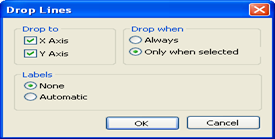
In the Drop Lines dialog box select an axis to draw the line to, whether to always show the drop lines, and whether to show labels.
When finished click OK.
Summary Card
The summary card is a really quick way to view information about a selection or the entire data source. The card shows the SUM, MIN, MAX, and Average for each measure in the view. You can hide or show the Summary Card by selecting it on the View Cards toolbar menu. You can also select View > Cards > Summary.
Consider this example, the view below is a scatter plot of profit vs. sales for three different product categories. You can see that the technology category contains high profit and high sales products (the green marks). When you select these marks, the summary card quickly shows you that these products account for $4,334,791 in sales with a minimum sale of $465,729.
View Data
The View Data command lets you display the values for each row in the data source that compose the marks. It also shows you the summary data based on the aggregations in the view. You might want to do view data to verify the aggregated value associated with a mark or to isolate and export the individual rows associated with data of interest such as outliers.
You can view data for a selection of marks, the fields in the Data window, and when you’re connecting to data.
The view shown below shows the average order quantity for two product dimensions as a bar chart. Suppose you want to view the data for the largest marks in each pane. To do this, select the marks of interest, right-click in the table, and select View Data on the context menu. Alternatively, you can select the Analysis > View Data menu item.

Note:
Viewing data may not return any records if you are using a field that contains floating point values as a dimension. This is due to the precision of the data source.
Describing the View
Occasionally you may want to summarize an analysis you have completed on a worksheet succinctly. You might then want to remind yourself of what it shows (the filters that are applied, etc.), and finally, you may want to share a summary of the analysis with someone else.
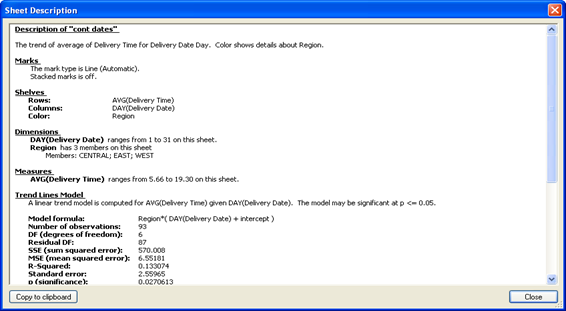
When you choose View > Describe Sheet, you can view a description of the workbook, data source, fields and layout of the current worksheet. This summary includes the Caption in the first line but expounds on other important summary information. This information can be copied and exported to other applications using the clipboard.
Note:
If you have Trend Lines turned on, the Describe Sheet dialog box includes information about the trend line model, including an anova table. Refer to learn more about the terms used to describe the model.
For in-depth knowledge on Tableau, click on below.
You liked the article?
Like : 0
Vote for difficulty
Current difficulty (Avg): Medium
About Author

Name
TekSlate is the best online training provider in delivering world-class IT skills to individuals and corporates from all parts of the globe. We are proven experts in accumulating every need of an IT skills upgrade aspirant and have delivered excellent services. We aim to bring you all the essentials to learn and master new technologies in the market with our articles, blogs, and videos. Build your career success with us, enhancing most in-demand skills in the market.
Stay Updated
Get stories of change makers and innovators from the startup ecosystem in your inbox