Point in Time reporting is easily achieved using set analysis. If you wanted to obtain the years sales for 2010 the following set analysis would be used:-
Sum({$<Year = {2010}>}Sales)
If you wanted to return Sales for the immediate previous year to whatever the user selects, you can use the aggregation function.
First determine the function that will return the required value, Max(Year) – 1. In this example if the user selects 2010, the function will return 2009, if the user makes multiple selections or no selections at all; you will still get the value of the previous year based on the last possible year.
Next you use this function as a set modifier in the final expression, as follows:-
$(=Function()) (NB equal sign)
The final expression would look as follows:-
Sum({$<Year = {$(=Max(Year) – 1))}Sales)
This approach works equally well for Quarters, Months, Days etc. however its’ limitation is demonstrated when working with months for example, if a user selects Month 1 (January) and uses the function Max(Month)a zero will be returned and this is not what is required.
Adding and Removing the Values to Selections:
The following operators can be used to modify the selections that have been made by the user
= Redefines the selection made for a given field
+= Defines a union between the selected field value and the next specified:-
Sum({$<Year += {2009, 2010}>}Sales)
This expression will return the sales for the years that the user has selected AND the years 2009 and 2010.
-= Defines an exclusion of the value specified from the value that the user has selected:-
Sum({$<Product -= {‘Product X’}>}Sales)
This expression will return the sales for the products the user has selected excluding Product X.
*= Defines the values that occur in both the users selections and the values specified in the set expression:-
Sum({$<Product *= {‘Product X’}>}Sales)
This expression will return sales for the current selection but only for the intersection of currently selected products and Product X.
/= this defines an XOR, the resulting record set will contain the values present in either one set but not in the other
Sum({$<ProductNumber*= {“33*”}>}Sales)
This expression will return sales for the current selection but only for the intersection of currently selected products and all the products with numbers starting with 33.
More Examples:
Sum of Sales and ignore specific selections for Customer Country and Policy Status
SUM( {$<[Customer Country] = , [Policy Status] = >}Sales )
Sum of Sales where Policy Created Year equals variable vMaxCreatedYear
SUM({$<[Policy Created Year] = {$(#vMaxCreatedYear)}>}Sales )
Sum of Sales where Policy Created Year greater than or equal to variable v2002
SUM({$<[Policy Created Year] = {">=$(#v2002)"}>}Sales )
Sum of Sales where Policy Created Year less than variable v2002
SUM({$<[Policy Created Year] = {"<$(#v2002)"}>}Sales )
Sum of Sales where Policy Created Year greater than or equal to v2002 and less than or equal to v2004
SUM({$<[Policy Created Year] = {">=$(#v2002) <=$(#v2004)"} >}Sales )
Sum of Sales where Product not equal to Life Plan
SUM({$<Product -= {"Life Plan"} >}Sales )
Sum of Sales where Policy Created Year is greater than1999 but less than 2004
SUM({$<[Policy Created Year] = {“>1999<2004”}>}Sales)
Sum of Sales for policies created in the Years beginning “200*”
SUM({$<[Policy Created Year] = {“200*”}>}Sales)
Sum of Sales excluding where Product equals *Plan*
SUM({$<~Product = {“*Plan*”}>}Sales)
Sum of Sales to include all current selections and the union of the 2 products, Life Plan and Fleet Secure
SUM({$<Product += {"Life Plan", "Fleet Secure"} >}Sales )
Sum of Sales to include all current selections and Years 20* and 1997 minus the year 2000
SUM({$<[Policy Created Year] += {“20*”,1997} – {2000} >} Sales )
Sum of Sales to include all current selections, and intersect of product Fleet Secure
SUM({$<Product *= {"Fleet Secure"} >}Sales )
Below expression returns the sum of sales for the previous year in relation to the current selection. A dollar-sign expansion is used to calculate the previous year:-
SUM({$<[Policy Created Year] = {$(#=Only([Policy Created Year])-1)}>}Sales )
Below expression returns the sum of Sales for all current selections excluding the products with Plan and Secure in their title
SUM({$-1<Product = {"*Plan*", "*Secure*"}>}Sales )
Below expression return the sum of sales for all current selections, with a new selection in the “Customer” field. Only include customers who during 2007 had total sales of more than 1000000
SUM({$<Customer = {“=Sum({1<Year = {2007}>} Sales ) > 1000000”}>}Sales )
YTD, QTD, MTD and WTD
Year, Quarter, Month and Week To Date are the common analysis that we have seen many applications.
First to do this your data model should have the DateField in number format by applying floor
Similar to this
Floor(DateField) AS DateNum //it will gives you one whole number to represent date
YTD - Year To Date
A date should be selected and it will look for the Starting date of the year to the selected date.
Ex: date selected is 21-03-2014 then YTD is 01-01-2014 to 21-03-2014 Expression would be
Sum({<Year=, Month=, Quarter=, Week=, DateField=,DateNum={">=$(=Num(YearStart(Max(DateNum))))<=$(=Max(DateNum))"}>} Sales)
QTD- Quarter to Date
In the place of year use Quarter
Sum({<Year=, Month=, Quarter=, Week=, DateField=,
DateNum={">=$(=Num(QuarterStart(Max(DateNum))))<=$(=Max(DateNum))"}>} Sales)
MTD- Month to Date
Sum({<Year=, Month=, Quarter=, Week=, DateField=,
DateNum={">=$(=Num(MonthStart(Max(DateNum))))<=$(=Max(DateNum))"}>} Sales)
WTD- Month to Date
Sum({<Year=, Month=, Quarter=, Week=, DateField=,
DateNum={">=$(=Num(WeekStart(Max(DateNum))))<=$(=Max(DateNum))"}>} Sales)
if you want you can set a variable value as 'Year', 'Month', 'Quarter', 'Week', lets say vTo Date and go with single chart and single expression
Sum({<Year=, Month=, Quarter=, Week=, DateField=,
DateNum={">=$(=Num($(=vToDate&'Start(Max(DateNum))')))<=$(=Max(DateNum))"}>} Sales)
What – IF Analysis:
What if analysis ‘is a technique that lets you assess changes before they happen. It greatly helps the business to predict their outcome of their decisions, lowering the risk. It also helps to quickly test a wide variety of scenarios using real-time data pulled straight from the database.
What-if scenarios can be useful in many cases. The sales driven organization for example, can take advantage of understanding the impact of rising costs, decreasing quantities of sold goods, changes in selling prices and how all of this affects the margin, just in a few simple clicks. It’s quite simple to create such a what-if scenario in Qlikview.
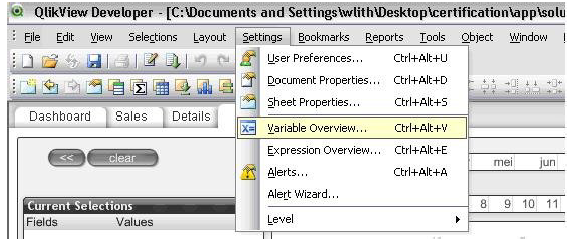
The first thing to do is declaring variables for sliders to increase or decrease the values in percentage (%) for Sales, Cost or Quantity. Navigate to settings and choose Variable Overview.
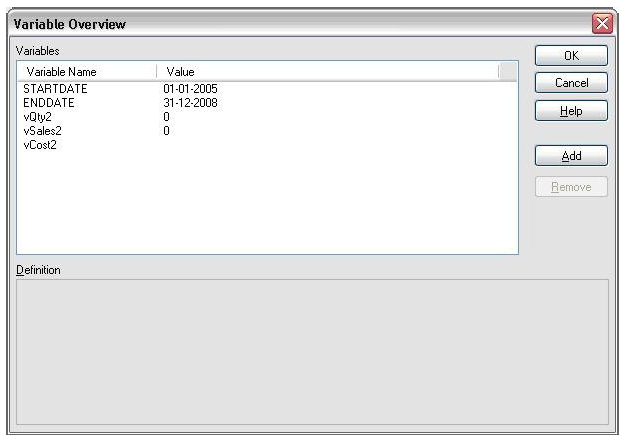
In the variable overview, add the three new variables: vQty2, vCost2 and vSales2.
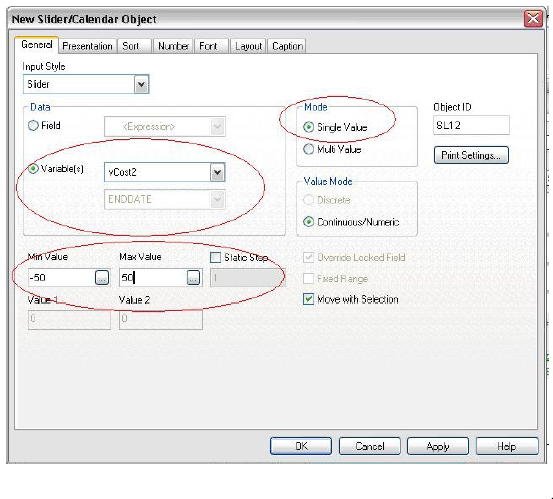
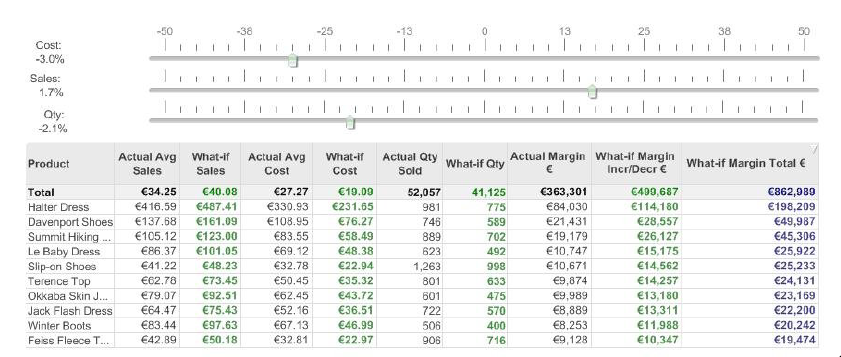
Now create three independent sliders with the following settings:
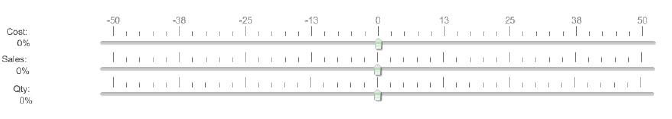
The cost, sales and Qty percentage (see picture below) text can be created by adding a text object with:
=’Cost: ‘&chr(10)&num($(vCost2)/100,’##.0%;-##.0%’)
Next thing to do is creating a straight table containing products as dimension and the following expressions:
Actual Avg Sales
Sum([Sales])/Sum([Quantity])
What If Sales
[Actual Avg Sales] * (1 + vSales2/100)
Actual Avg Cost\
Sum(Cost)/Sum(Quantity)
What-if Cost [Actual Avg Cost] * (1 + vCost2/100)
Actual Qty Sold Sum(Quantity)
What-if Qty [Actual Qty Sold] * (1+vQty2/100)
Actual Margin Sum(Margin)
What-if Margin Inc / Decr [What-if Margin Total €] – [Actual Margin €]
What-if Margin Total ([Actual Qty Sold] * (1+vQty2/100))*(([Actual Avg Sales] * (1 + vSales2/100)) – ([Actual Avg Cost] * (1 + vCost2/100)))
When you finished the straight table, all you have to do is change the sliders to see the direct impact of changing costs, sales or quantities.
Of course there is the possibility to visualize what happens by creating some bar charts. Just copy the straight table and adjust the settings to your own wishes. Enjoy!

You liked the article?
Like: 0
Vote for difficulty
Current difficulty (Avg): Medium

TekSlate is the best online training provider in delivering world-class IT skills to individuals and corporates from all parts of the globe. We are proven experts in accumulating every need of an IT skills upgrade aspirant and have delivered excellent services. We aim to bring you all the essentials to learn and master new technologies in the market with our articles, blogs, and videos. Build your career success with us, enhancing most in-demand skills in the market.

